


Advanced NFL Strength of Schedule 2021

NFL Strength of Schedule 2021
As you're viewing Fantasy Data's 2021 Fantasy Football Rankings this year, you might notice an SOS column with a letter grade assigned to them. You may wonder how we determined those ratings or what they mean (SOS = Strength of Schedule if you didn't already know). Well, as the creator of those grades, I can fully explain exactly what they mean and the process it took for me to establish them. You may see other Strength of Schedule ratings or charts across the internet, and if you're like me you're probably disappointed to learn they are 100% based on last year's finishes for each team. Creating an "Advanced SOS" spreadsheet/workbook is a project I have been wanting to do for a few years and this year I was finally able to tackle it. Let's work through the process together so that when you see those letter grades on our rankings pages you will understand exactly what is represented in that column.
The Beginning of the Process
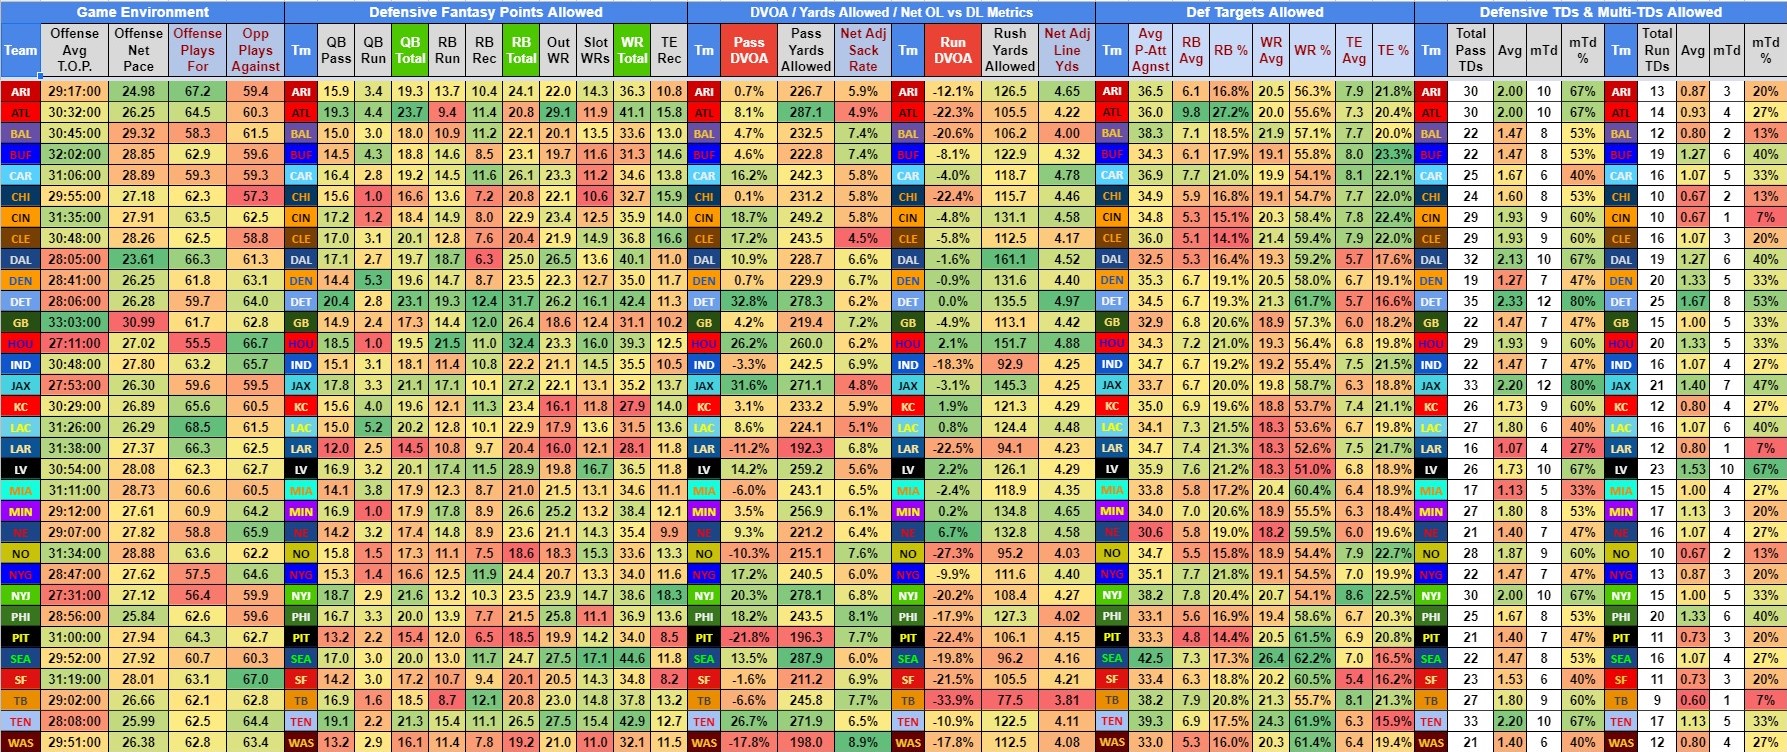
Where most SOS ranking end was where I started my process. It's not a terribly tough task to toggle through last year's data and see who was bad or good at stopping the run or pass. If you're clever, you can make a fancy chart with team logos as a visual and call it a day. Instead, let's take that data and start looking for what has changed since then to determine if that data has any relevance in 2021. If you followed my work last year and remember those weekly DraftKings DFS Workbooks, those provide a great start to building a baseline for what we want to analyze and adjust for this year. The screenshot below has many interesting data points to begin the process for determining a 2021 Advanced Strength of Schedule. The data in this chart is what I wanted to use once I got to the reconciliation point of the project to determine how much better or worse a team would be after the majority of the offseason moves have taken place.
The first thing I wanted to do was compare this data to the previous year to see Year Over Year (YoY) improvement or decline. So, I pulled the defensive data from our NFL Team Stats pages and did a simple comparison for Pass and Run Defensive stats. In the Passing Data Chart below, we want to focus on the third box which has the actual YoY Improvement figures (negative numbers indicate the defense got tougher in those categories).
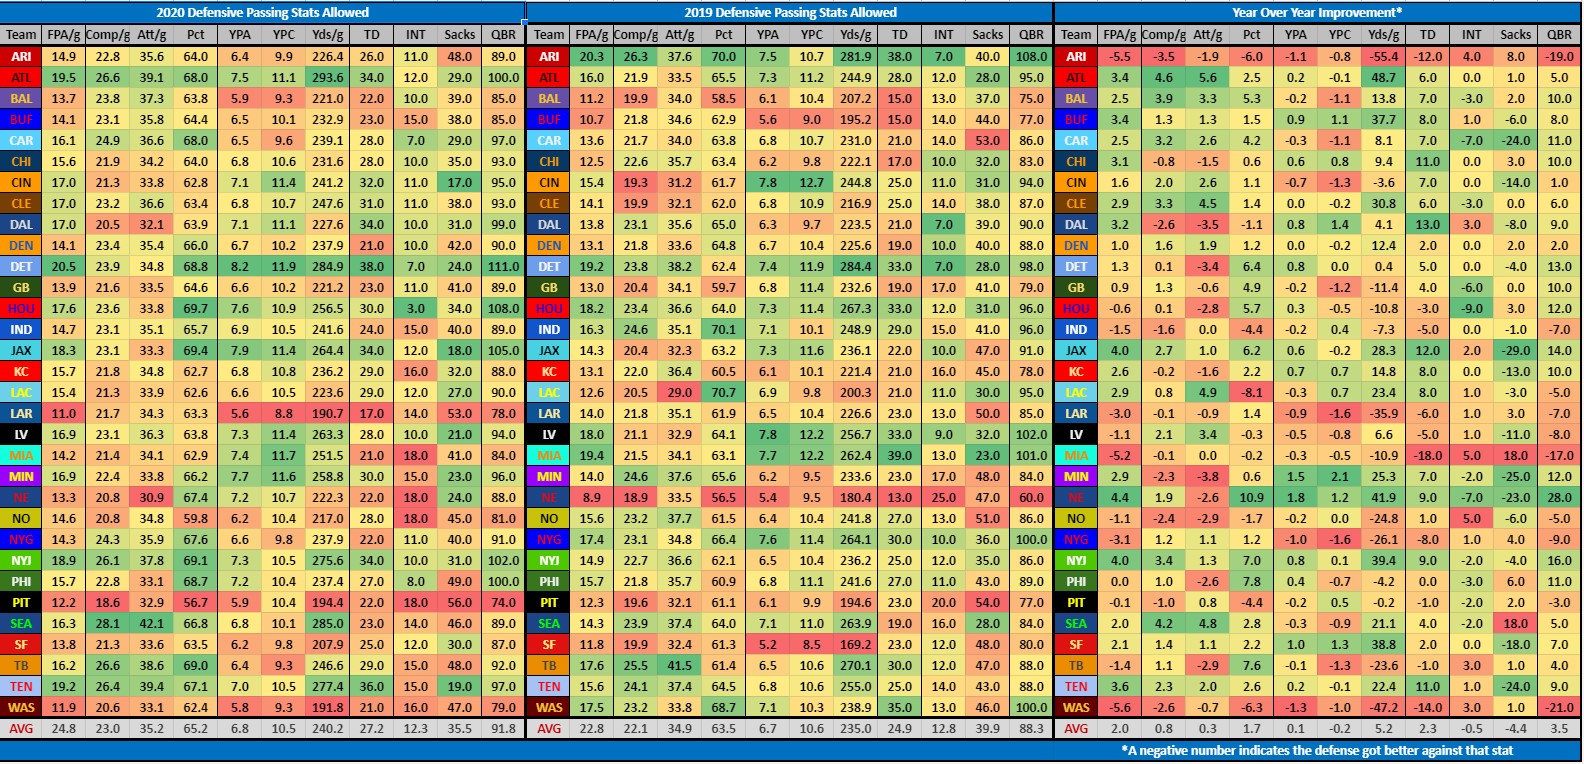
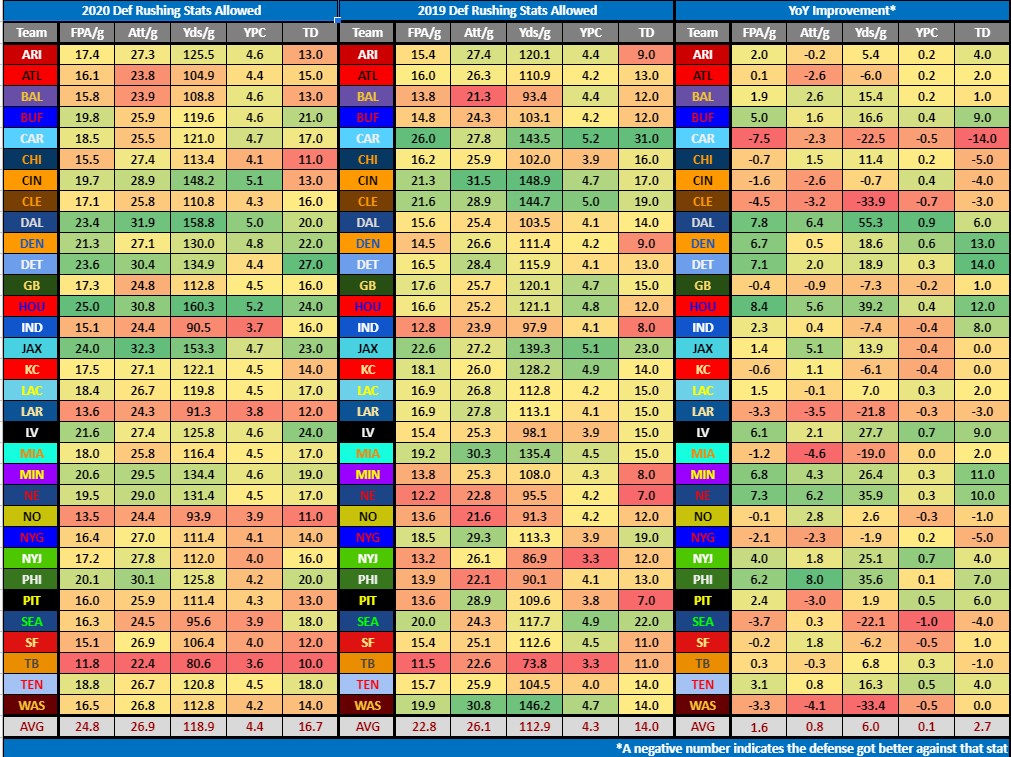
I did this for Run Defense data as well.
2021 Roster Changes
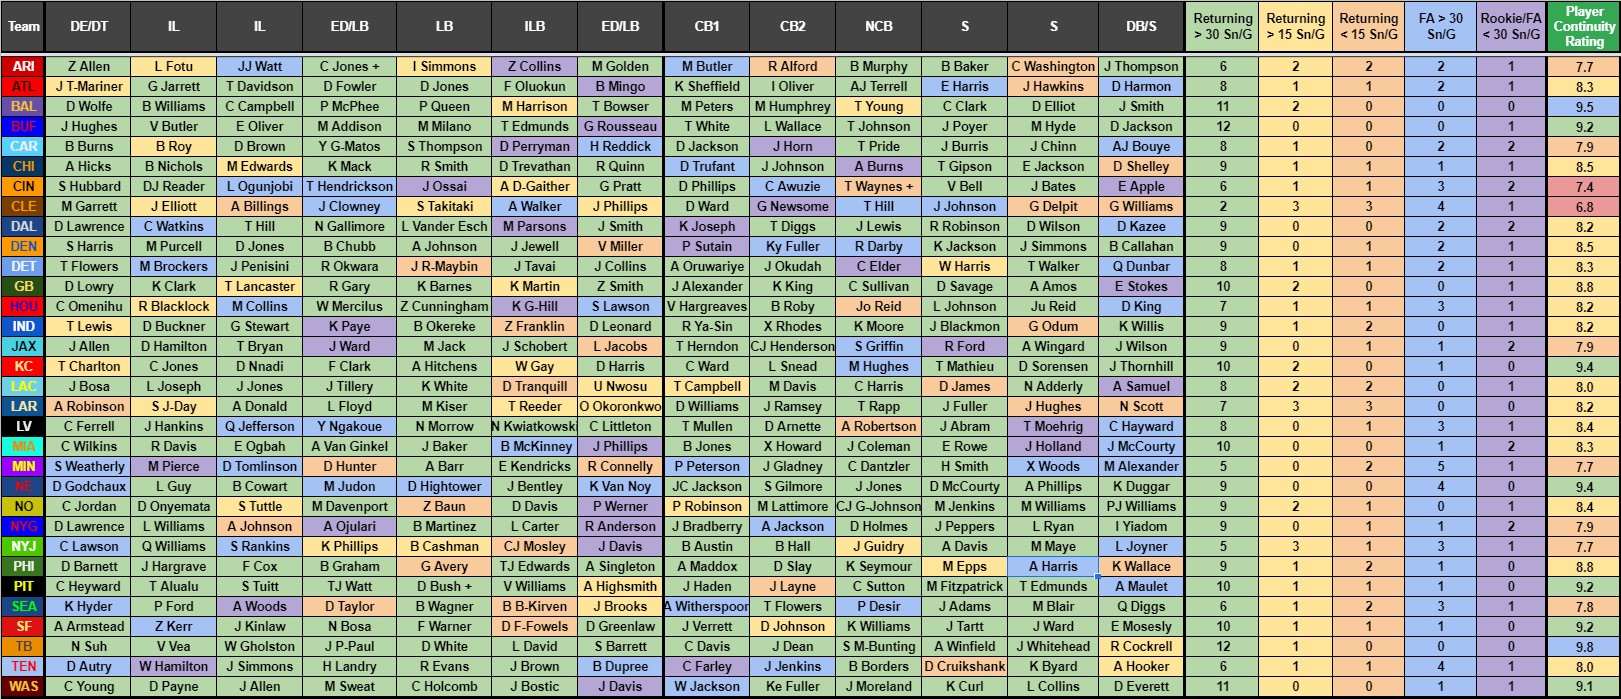
With 2 years of data and a YoY trend, I wanted to determine how many of the players that produced the data were going to be there for 2021. Using our NFL Depth Chart page, I created a spreadsheet with a "Player Continuity" rating system. Teams bringing back the same players (and coaches, but we'll get to that next) have a greater chance at repeating their prior performance. Productive teams with high continuity ratings are perceived to have already jelled together, and barring injury, those teams shouldn't make a drastic move up or down from their previous year(s) rankings. The Continuity Chart displays the current starting 11, along with the projected Nickle Cornerback, as well as 1 additional defensive back to account for teams that play more nickel-based schemes. The ratings in the far-right column are color-coded in rainbow order from Blue to Red with Blue being the highest continuity. This chart is a good way to visualize which teams are sticking together and who are making wholesale changes to their defenses this year. Team with new players learning new schemes could start slow as they figure out communication and how to cover their assignments. We might want to target those low-continuity defenses early, especially in DFS.
2021 Coaching Changes
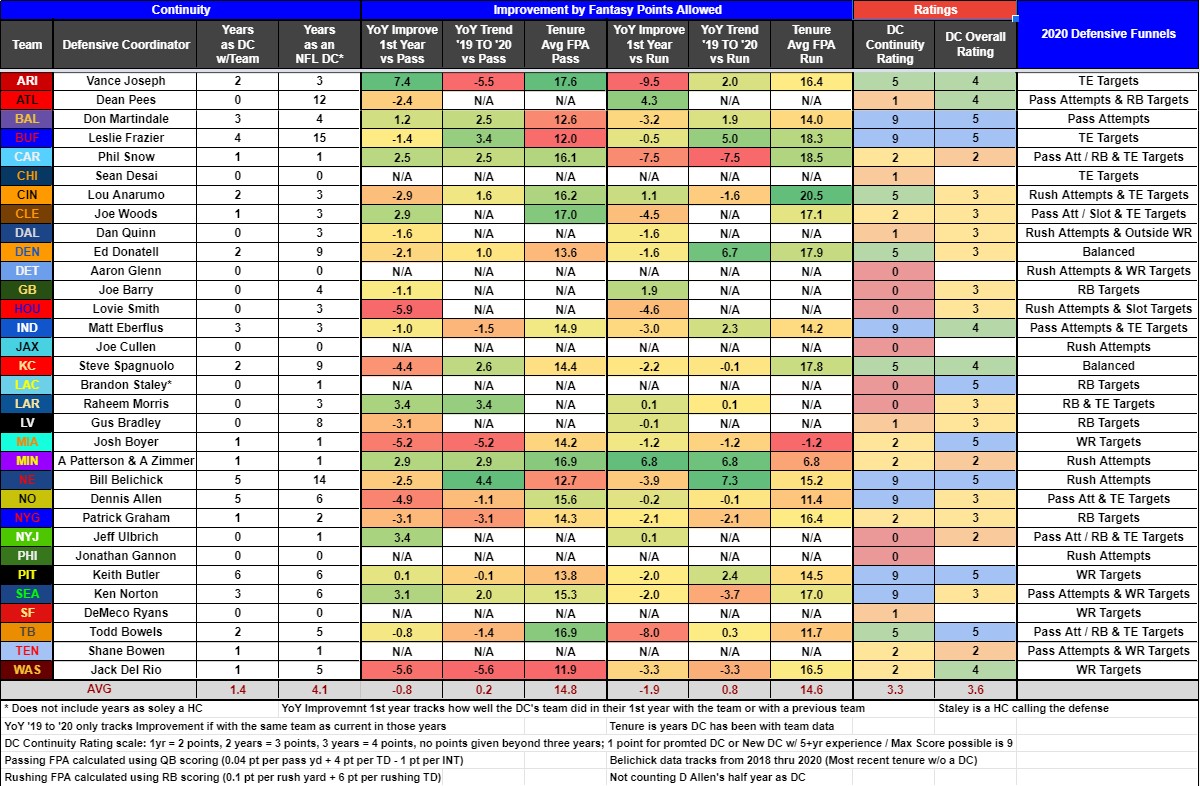
After looking at the continuity of players, I felt it necessary to analyze teams that are replacing their defensive coordinator and/or adopting a new defensive scheme. Teams running the same scheme for multiple years with high player continuity should be expected to maintain their level of play or improve. Teams with new coordinators may have players learning a new scheme and could start out allowing offenses to take advantage of them early in the year. Some teams are replacing a departing defensive coordinator by promoting a coach that was already on the staff last year. I created a formula for each coaching scenario to derive a continuity score from 0 to 9. Then, created a simple 1 through 5 scale to rate the quality of the defensive coordinator based on their historical results.
The chart below shows each experienced defensive coordinator's results in their first year with the team they are still coordinating, and for the coordinators who are new to their team in 2021, it shows their first-year results with the last team they coordinated. It also shows a 2019 to 2020 YoY trend for the established coordinators as well as their Average Fantasy Points Allowed in both the Passing and Rushing defense categories. The column titled "Tenure Avg FPA Pass/Run" calculates the defense's average fantasy points against through passing (calculated by QB scoring) and rushing during the defensive coordinator's current tenure with their team. The last column of the chart shows where each team may have had a soft spot or funnel on defense.
Reconciling the Data
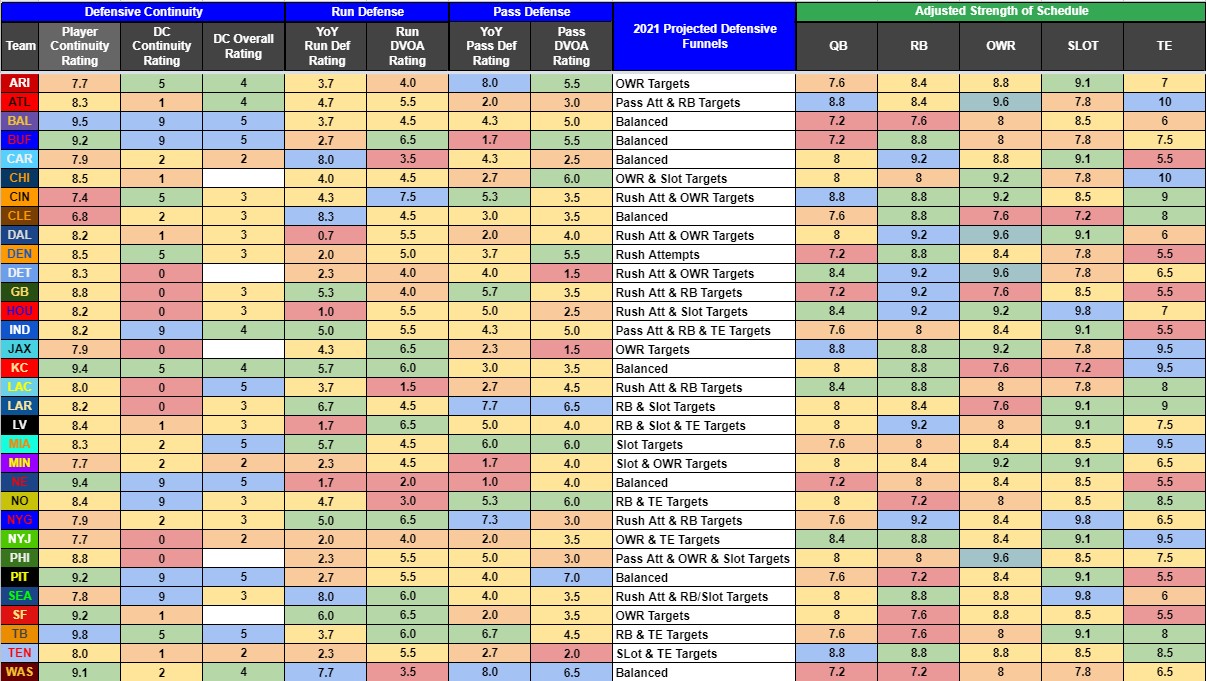
Okay, so we picked up where we left off by looking at the final Matchup Chart of 2020, we established YoY Improvement by the defense, we reviewed roster changes to determine player continuity and ended the data collection process by looking at Defensive Coordinator trends and possible soft spots (or funnels) in their scheme. What we need to do now is reconcile all this data and arrive at a rating for each defense this year then apply that to every team's 17 game schedule to calculate a Strength of Schedule rating. To do this I compared that final Matchup Chart and where defenses were allowing points and adjusted those numbers based on the other data gathered and adjusted those figures based on roster improvement and coaching changes. Then, I boiled that down to a number rating between 1 and 10, which ended up being more like a 5 - 10 rating which made it easier to assign the letter grades that were requested for this project. Here's what that final reconciliation looks like.
Signup To Read More
Now is a great time to sign up, save big with FantasyData's 2021 NFL Season Passes
Jess Jones
NorCal native Jesse Jones has been obsessed with fantasy football since first joining and winning a league in 1994. Always looking for an edge, Jess has been ahead of the curve mining data and building customized spreadsheet rankings and projections while others showed up to draft day asking for a pencil and a cheat sheet. Avid DFS, Best Ball and Re-Draft player that dabbles lightly in Dynasty. When not geeking out on Fantasy Football, Jess can be found hiking, kayaking, swimming, playing tabletop games, cooking, trading equities, listening to good tunes and/or enjoying a craft brew or two.
