Fantasy Football Draft Strategy
We all know the late-round quarterback strategy made famous by NumberFire and FanDuel’s very own JJ Zachariason, but if everybody is following the same approach, is there an advantage to going against the grain? Or is it just so practical that executing anything but taking a quarterback later creates a disadvantage? These are the questions I asked myself when studying quarterback strategy in standard redraft leagues. Through discussions with other analysts, it was brought to my attention that the late-round quarterback strategy is like golfing with spikes; it inherently makes you better despite the fact that everybody is doing it. Wearing sneakers won’t make you better at golf. Though the parallels made sense, I wanted to conduct my own research.
One of my goals was to find a method for the most important players in real football to be just as important in fantasy football. Now from a rule change or league format standpoint, yes there are many ways to make quarterbacks more valuable. Two quarterback leagues, Superflex leagues, higher scoring for quarterbacks, more negative points for interceptions/fumbles, and even a separate draft where just quarterbacks are drafted separately from the rest of the skill players. However, in most leagues from personal experience rule changes can be very difficult to implement.

I will also provide best practices on how you can get your favorite quarterback early and still draft a balanced roster that will not have your league mates ridiculing you. Essentially get your quarterback cake and get to eat it too. But, in the end, answer the question: Can you create an edge on a weekly basis by taking a quarterback early in fantasy football?
The Name of The Game is Value
Why the later-round quarterback such a popular strategy for fantasy owners? Because it is based on positional value. The quarterback position is so deep and the difference between the QB1 and the QB12 is not always super significant. For example, last season Patrick Mahomes scored 417.08 points as the QB1. But between the QB2 Matt Ryan at 353.96 points and QB12 Kirk Cousins at 283.12 points, the difference was 70.84 points. Now in comparison to the wide receivers and running backs you’ll see a different story.
In PPR, DeAndre Hopkins scored 333.5 points as the WR1 and the WR12 Keenan Allen at 260.1 points. The difference is 73.4 points. For running backs in PPR, this is where the largest difference was. Saquon Barkley scored 385.8 fantasy points as the RB1 and Kareem Hunt scored 230.2 points as the RB12. The difference of 155.6 points.
In PPR at tight end, Travis Kelce as the TE1 scored 294.6 fantasy points and the TE12 Jimmy Graham scored 130.6 fantasy points. The difference being 164 fantasy points. What happens when we look at the averages of the finishes going back a few more seasons? What is the QB1 points-wise?
Well dating back to 2007 here are the averages of QB finish totals of the top 12 quarterbacks. The percentages in the right column represent the percent difference from one QB rank to the next one. Interesting that the largest drop-off comes from QB1 to QB2 at an average of 7.67%.
| 1 | QB1 | 358.2983333 | |
| 2 | QB2 | 330.8 | -7.67% |
| 3 | QB3 | 315.3 | -4.69% |
| 4 | QB4 | 305.5083333 | -3.11% |
| 5 | QB5 | 296.405 | -2.98% |
| 6 | QB6 | 284.66 | -3.96% |
| 7 | QB7 | 277.305 | -2.58% |
| 8 | QB8 | 270.9366667 | -2.30% |
| 9 | QB9 | 262.2233333 | -3.22% |
| 10 | QB10 | 254.1983333 | -3.06% |
| 11 | QB11 | 250.4533333 | -1.47% |
| 12 | QB12 | 244.8466667 | -2.24% |
For wide receivers, the largest drop-off is from WR1 to WR2 and WR3. Then it is a steady linear decline of about 2% from WR3 onto WR12.
| 1 | WR1 | 339.3083333 | |
| 2 | WR2 | 320.4083333 | -5.57% |
| 3 | WR3 | 302.9833333 | -5.44% |
| 4 | WR4 | 296.0116667 | -2.30% |
| 5 | WR5 | 289.9166667 | -2.06% |
| 6 | WR6 | 283.25 | -2.30% |
| 7 | WR7 | 276.4083333 | -2.42% |
| 8 | WR8 | 269.475 | -2.51% |
| 9 | WR9 | 263.6216667 | -2.17% |
| 10 | WR10 | 257.8916667 | -2.17% |
| 11 | WR11 | 251.6166667 | -2.43% |
| 12 | WR12 | 247.1583333 | -1.77% |
Running back had the largest dropoff in production from the RB1 to the RB2.
| 1 | RB1 | 368.7283333 | |
| 2 | RB2 | 327.9983333 | -11.05% |
| 3 | RB3 | 308.935 | -5.81% |
| 4 | RB4 | 293.35 | -5.04% |
| 5 | RB5 | 276.475 | -5.75% |
| 6 | RB6 | 262.5316667 | -5.04% |
| 7 | RB7 | 251.975 | -4.02% |
| 8 | RB8 | 245.75 | -2.47% |
| 9 | RB9 | 236.75 | -3.66% |
| 10 | RB10 | 230.075 | -2.82% |
| 11 | RB11 | 223.195 | -2.99% |
| 12 | RB12 | 217.425 | -2.59% |
The tight end position had the second-highest drop-off in production from TE1 to TE2.
| 1 | TE1 | 264.7416667 | |
| 2 | TE2 | 235.8233333 | -10.92% |
| 3 | TE3 | 221 | -6.29% |
| 4 | TE4 | 206.2333333 | -6.68% |
| 5 | TE5 | 197.5916667 | -4.19% |
| 6 | TE6 | 183.725 | -7.02% |
| 7 | TE7 | 173.3833333 | -5.63% |
| 8 | TE8 | 168.75 | -2.67% |
| 9 | TE9 | 162.3083333 | -3.82% |
| 10 | TE10 | 157.0083333 | -3.27% |
| 11 | TE11 | 150.2083333 | -4.33% |
| 12 | TE12 | 143.625 | -4.38% |
Overall when looking at the four positions the RB1 on average since 2007 has scored the most fantasy points in PPR followed by QB1, WR1, and then TE1.
In the chart below you can see the difference between different ranges of the number one overall finish on average at each position versus the third, fifth, 10th, and 12th average overall finishes.
| QB1 | QB3 | -12% |
| QB1 | QB5 | -17.27% |
| QB1 | QB10 | -29.20% |
| QB1 | QB12 | -31.66% |
| RB1 | RB3 | -16.22% |
| RB1 | RB5 | -25% |
| RB1 | RB10 | -37.60% |
| RB1 | RB12 | -41% |
| WR1 | WR3 | -10.71% |
| WR1 | WR5 | -14.56% |
| WR1 | WR10 | -24% |
| WR1 | WR12 | -27.16% |
| TE1 | TE3 | -16.52% |
| TE1 | TE5 | -25.36% |
| TE1 | TE10 | -40.69% |
| TE1 | TE12 | -45.75% |
As seen by the charts quarterback and wide receiver are the deepest positions from the top-12, whereas for a tight end and running back production falls off over 40% by the time the 12th best player at the respective position. That is why if you do any mock draft right now you will see running backs being targeted extremely heavy early on and even Travis Kelce sneaks into the first round. And even though the drop off from wide receivers is less than quarterbacks, in most leagues you will have to start multiple receivers versus just one quarterback. In conclusion, even if you land the overall QB1 on your team and were to play the team with the QB12 every single week, you’d end up losing because of the value that team would have over yours at the running back, wide receiver, or tight end position. However, what can be salvaged here from an early-round quarterback approach is exactly when the QB1 is drafted.
We all the know the first quarterback off the board is going to go in the 4th round in most leagues. This is consistent across multiple sites that record ADP that include FantasyFootballCalculator and Draft.com. Currently, in 2019 FantasyFootballCalculator has Patrick Mahomes at 3.06 with standard deviation at 4.6. In 2018, Aaron Rodgers was going 3.07, 2017 Rodgers went 2.11, and 2016 Cam Newton was 3.11. Draft.com has Mahomes going at 3.12 in current best ball formats. FantasyData’s ADP has the first quarterback going over the past four years at approximately 29.2 overall. So my best practice for anybody would be the fifth round is when you start to get value at the quarterback position. That’s because at this point you comparing the QB1 to the likes of RBs and WRs at the backend of the Top 24 at their positions. But that is not the only advantage you can get from an early-round quarterback.
Waiver Wire Advantage
One advantage to having one top-tier quarterback on your roster is that you are no longer subject to FAAB losses on the waiver wire. It also offers more opportunity for you to be aggressive with your budget on running backs that find themselves in bell-cow roles after injuries take place during the season. You also won’t have to roster two quarterbacks for the majority of the season whereas those who take quarterbacks later tend to draft two. So how do you make the best use of your one high-end quarterback? Get his weapons.
A method to do this is to stack your high-end quarterback. It’s more of a daily fantasy sports strategy but could be leveraged in seasonal leagues as well. By committing to your quarterback early you need to invest in him succeeding best you can. Obviously taking a quarterback high means you have confidence in them so you need to follow through. So target his receivers and tight ends throughout your draft. Build around your-high end quarterback in mind. Now his high-end production weeks will provide a larger edge. Also, keep in mind the early season schedule. The last thing you want to do if you invest high draft capital in a quarterback, and then when Week 2 comes around you are already looking at the waiver wire for another option.
Again when you decide to take the first quarterback off the board you are more often than not losing value. But is there a degree of safety in quarterback play that can make up the difference?
Safety First
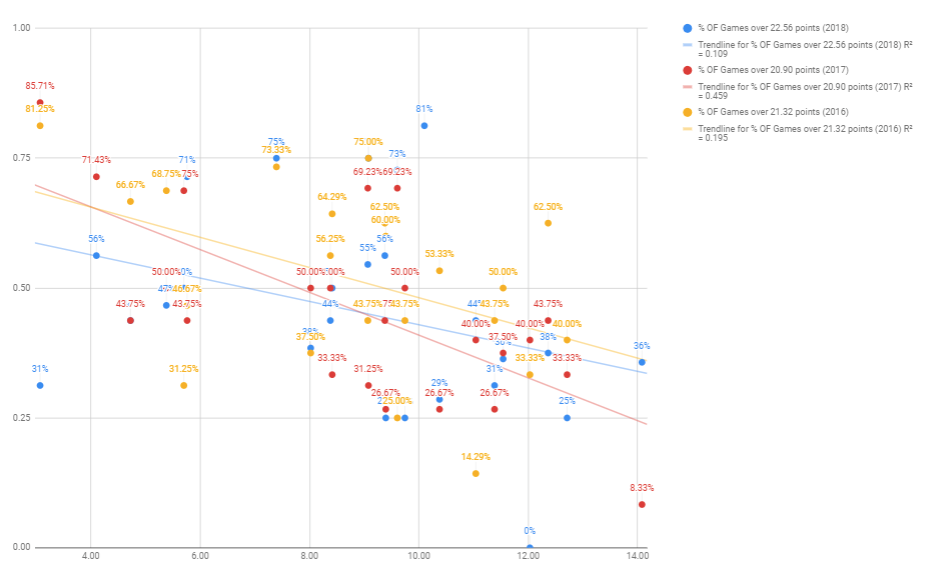
We have the common belief that when we invest more in something that it will be more reliable. Now we apply this theory to fantasy football! I looked at how often quarterbacks scored at least 22.56 points in 2018, 20.90 points in 2017, and 21.32 points in 2016 via FFToday’s Quarterback Consistency Rankings. I then compared those players weekly finishes with their average ADPs over those three seasons. The following graph depicts my findings.
The first graph shows the highest correlation between higher ADP and more 20.90+ fantasy point performances occurred in 2017 at a correlation coefficient of 0.459. That was significantly higher than in 2016 (0.195), and 2018 (0.109). It’s important to note that that correlation may have to relate to the 2017 point threshold of 20.90 being lower than the other two seasons, making it easier to attain. Thus, in the next graph, I looked at analyzing the last three seasons on average instead of by each season individually.
Now one can find that when the threshold increases to 21.78 points the correlation coefficient is not as strong (0.345) when looking at the averages across the past three seasons.
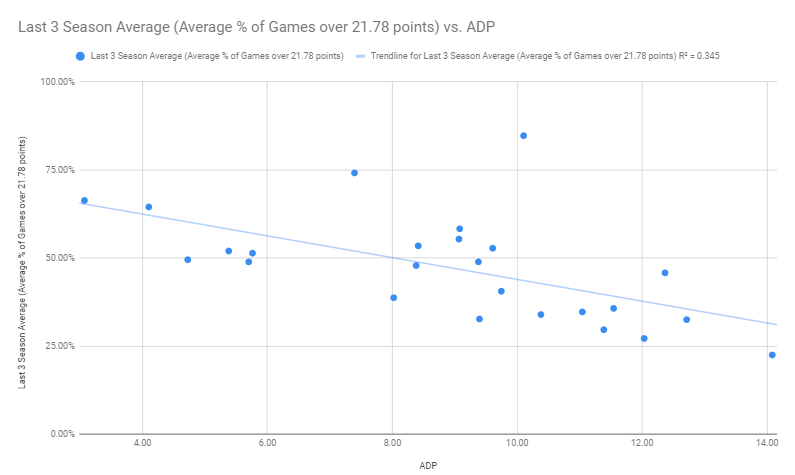
The main objective of these graphs was to prove whether or not quarterbacks took earlier would be safer. The correlation is just not strong enough to support this theory. When you just consider the top-five quarterbacks based on ADP versus quarterbacks six-ten, were are left with the following results. The top-five group had an average ADP of 4.59 and scored above the 21.78 thresholds 56.29% of the time. That’s nine-game above 21.78 points in a 16-game season. But the next group practically shows identical results. The top six-ten group had an average ADP of 7.59 exactly three rounds later than the first group. But the threshold over 21.78 points was 53%! That equates to 8.48 games above 21.78 points in a 16-game season. Almost identical to the first group, but coming with a large three round discount. For reference the groups for 11-15 and 16-20 were also taken and here were their results:
The top 11-15 group had an average ADP of 9.30 and scored above the 21.78 thresholds 49.66% of the time. That equates to eight games above 21.78 points in a 16-game season. The top 16-20 group had an average ADP of 10.53 and scored above the 21.78 thresholds 44.77% of the time. That equates to 7.16 games above 21.78 points in a 16-game season. You can see there is no much difference going from one quarterback tier to the next.
Essentially taking a quarterback from the 16-20 group creates a gap of approximately two fewer games of reaching the 21.78 point threshold, but in return allows, you snag another position of need within the six rounds where you passed on the quarterback position. The extra one or two games with a 21.78 plus point performance are not worth the price tag. And that leads us to the discussion of opportunity cost.
Opportunity Cost:
The biggest advantage to the late-round quarterback strategy is the opportunity cost created from it. When a quarterback is drafted early, you miss the opportunity of drafting a higher tiered running back or wide receiver. Those positions have a more sense of urgency surrounding them because of the low supply (less elite players), and higher demand (start more than one). It’s also more important to address the running back and wide receiver first because according to the bust rate data via JJ Zachariason, the odds of you actually getting significant fantasy assets at wide receiver and running back past round five or six is not favorable. Then when you factor in the idea behind replaceability on a weekly basis and though it’s not a perfect science quarterback is a more streamable position than running backs and wide receivers. This because of their availability and their predictability on a weekly basis.
However, on a weekly basis, Zachariason’s findings showed that early-round quarterbacks do not bust as other positions do. Among quarterbacks ranked first to third over the last five years, 80% have finished as a top-six quarterback. The QB4 to QB6 range sees a dramatic dip to 33.33%, which only strengthens the point of top-notch consistency at the quarterback position. But does that consistency provide a weekly advantage for you over your opponent?
Quarterback Consistency Ratings
Via ESPN, here are the Consistency Ratings from 2016-2018. The benchmarks are based on the following:
- Start: The number of times that the player’s point total in a given week was worthy of having had him active in an ESPN standard PPR league. Top ten quarterback finish.
- Star: The number of times the player’s point total ranked among the top at his position. Top two quarterback finish.
- Stiff: The number of times the player’s point total ranked among the worst at his position, making almost any waiver-wire option a smarter choice. Finishing outside the top 20 quarterback finishes.
- Start%: The player’s “start percentage,” which shows how often he earned your start in an ESPN standard PPR (points per reception) league. This is his number of “Starts” — those defined below — divided by his number of scheduled team games.
- Consistency Rating (CR): The player’s “consistency rating,” which is calculated as his weekly standard deviation divided by his PPR fantasy points per game average. This is meant to identify the players who were most consistently close to their weekly averages. The lower the number, the more consistent the player. Again, lower numbers are better.
The following graphs give a more visual look at the data.
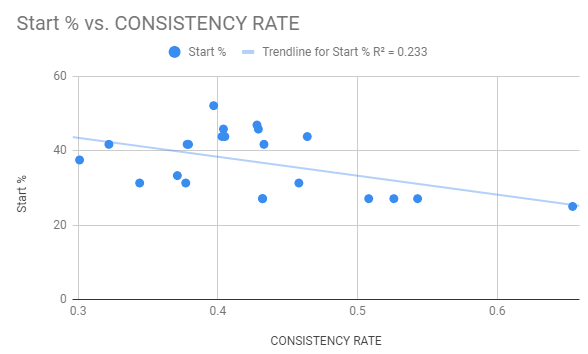
The first one below depicts Start% vs CR. Now what this graph shows is that the correlation between players started often and having lower consistency rates is not particularly strong. Though the linear trendline does show that to be the case, in general, it is not overwhelming with correlation coefficient at 0.233. Quarterbacks taken earlier in drafts are started more often but their consistency ratings are only slightly lower. Again meaning staying closer to their weekly averages. Whereas quarterbacks with later ADPs are started less have similar consistency rankings.
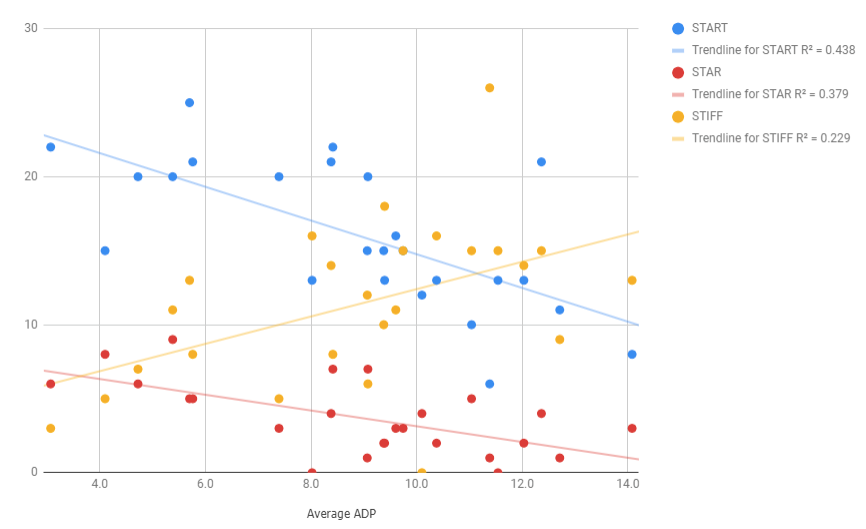
The next three graphs all now include current 2019 ADP data for quarterbacks. This first one below here depicts the three different benchmarks in terms of types of performance a quarterback can have (Start, Star, or Stiff). This graph shows the highest correlation between quarterbacks drafted with high ADPs lead to the most Top-10 finishes. The later they are taken the less Top-10 finishes those quarterbacks are likely to achieve. The next highest correlation is with Star performances (Top-2). Again the trendline though not as strong with Top-10 the general projection shows the same concept. The later quarterbacks are taken the less Top-2 finishes those quarterbacks are likely to achieve. Then with the last metric in Stiff (Outside Top-20), the trendline shows quarterbacks taken with late ADPs, have more games finishing outside the top-20.
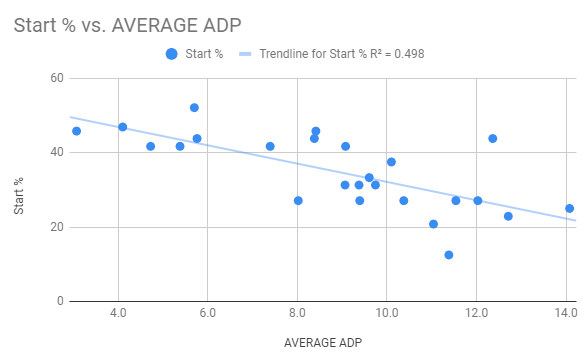
This graph depicts the Start % versus average ADP for quarterbacks. This graph had the highest of a correlation coefficient in all the data collected. It confirms the hypothesis stated earlier that quarterbacks with earlier ADPs are started more often.
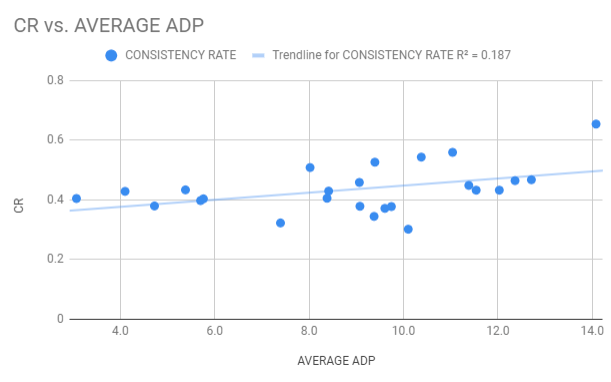
This graph depicts the CR versus average ADP for quarterbacks. Now, this graph shows the lowest correlation coefficient at 0.187 between the average ADP in consistency ranking. Thus, the takeaway here is that having a higher ADP does not necessarily translate to a low consistency rate.
So what are the major takeaways from the Quarterback Consistency Ratings? Well for starters when you draft a quarterback earlier, you are not actually getting a more consistent player. That in terms of players who were most consistently close to their weekly average. However, taking a quarterback earlier will most likely create more Top-10 finishes with the higher correlation coefficient (0.438) tied to that metric. From a general perspective, the high-end quarterbacks will give you more quality week starts than those taken later. But that does not create an edge. There’s no edge to be found when it comes to quarterbacks in their consistency in the way we have defined it. This makes sense with prior research done by Pro Football Focus’ Pat Thorman as well.
Pat Thorman
Via the LateRoundQB.com, Thorman compared three groups of quarterbacks using 2012 data – QB1-10, QB11-20, and QB21-30 – and showed the group of quarterbacks’ production versus top half and bottom half defenses. According to Thorman’s study, top-10 quarterbacks scored an average of 19.8 fantasy points per game against top half defenses, and 21.6 points against bottom half ones. The group’s average points per game were 20.7.
The next group of passers – quarterbacks ranked 11th through 20th – saw an average of 16.2 points per game, regardless of the defense that was faced. But much of this average had to do with a low score against top-half defenses. This middle group of passers scored 13.1 points per game against the good defenses in the league, but 19.0 against bottom half ones. That 19.0 score was just 1.7 points away from the average points per game you’d find from a top-10 quarterback in 2012. The final tier of quarterbacks saw 14.6 points per game average, but against bottom half defenses, the average jumped to 16.4.
Conclusion
In the end, taking a quarterback in the early rounds will reward you with a player that will finish in the top-10 on a weekly basis more often than not. Whereas at the surface that sounds great, but in reality, it does not provide any significant edge that fantasy owners would hope to gain from taking an early quarterback. Remember most leagues are either 10 or 12 teams so having a top-ten quarterback on a weekly basis is practically something you’ll have by default.
When you tie in everything presented in this article, it confirms that the late-round quarterback strategy from a value perspective while drafting is indeed the best methodology. The quarterback is inferior in value compared the other positions, their safety does not help you win, and even with best practices initiated with a high-end quarterback, everything needs to work out in your favor. The biggest being that we may not know who the overall QB1 even will be.
So to answer my question in the introduction: Can you create an edge on a weekly basis by taking a quarterback early in fantasy football? The answer is sheer no. But for those out there that looking to embrace a strategy look to take your number one ranked quarterback after round five. And know that every round after five you are getting some value back for your quarterback. So Patrick Mahomes in round four? Yeah, I would skip that one. But how about Aaron Rodgers or Deshaun Watson in the seventh? Now you have my attention!
Thanks for Reading!
Consider Signing Up For FantasyData Premium! The Best Players Have The Best Data

