

Advanced metrics are widely used amongst the fantasy football industry to help us decide which players we should be buying and selling each season. All of these stats help breakdown individual player performance better to give us an understanding of their strengths and weaknesses. In fantasy football, however, we are after one thing; fantasy points. So, I wanted to do a few things to get a better understanding of what the advanced metrics offered at FantasyData (powered by PlayerProfiler) mean to us for each position.
The correlation was made possible with some help from my friend and Fantasy FAQs Podcast co-host, Seth Keller (@FFTheAtHomeDad). The correlation turned into the meat of this project as we wanted to know which metrics are the most valuable in fantasy. This is important to know because it’s something that we can utilize in predraft mode before the season starts and in-season to identify value in a player that hasn’t broken out yet. You can also use it when analyzing trades to know if a player’s value could go up or down based on how they rank in the most critical metrics or while building lineups for DFS purposes.
Let’s get to the numbers.
Quarterback
Here is a list of the advanced metric categories we will be analyzing for QB and their meaning.
- Protection Rate (Pro. Rate): Percentage of plays in which a QB is well protected.
- Pressured Completion Percentage (Press. Cmp%): The percentage of passes completed while under pressure from a defender.
- Total Air Yards: Isolates the yardage gained by wide receivers and tight ends strictly from the depth of a quarterback’s throws.
- Air Yards Per Attempt: Divides total air yards by the number of pass attempts
- Deep Ball Attempts: Passing attempts that travel 20 yards or farther in the air.
- Target Separation: Average target separation for all running backs, wide receivers, and running backs receiving passes beyond the line of scrimmage.
- Dropped Passes: Catchable passes dropped by the intended target.
- Red-Zone Attempts: Attempts close to the goal inside the player’s 20-yard line
- Red-Zone Completion Percentage: Percentage of passes completed inside the red zone.
- Interceptable Passes Per Game: Amount of passes thrown per game that could have been intercepted by the defense.
Which Metrics Matter the Most?
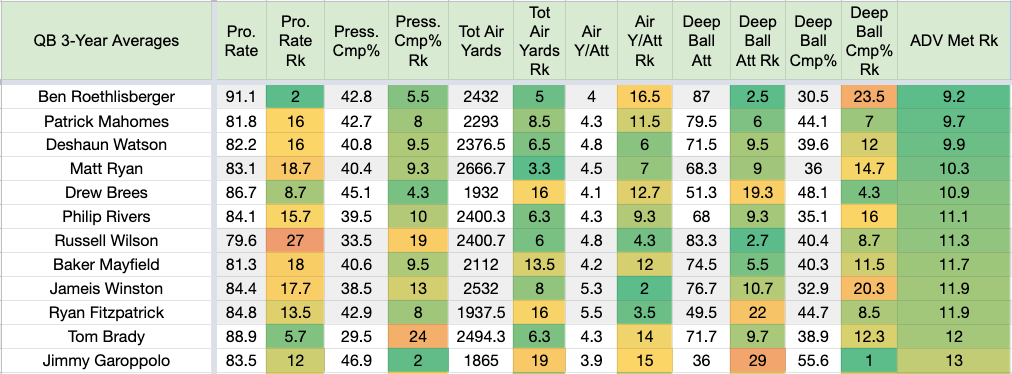
Here is a list of how well these advanced metrics have correlated to final ranks in fantasy over the last three years on average. While PPG rank isn’t necessarily an advanced metric, I included it as well for reference. Also, just because a metric doesn’t correlate closely to final ranks in fantasy doesn’t mean it’s not useful. These all have a place in analyzing player performance. Some are just more useful than others from a fantasy perspective.
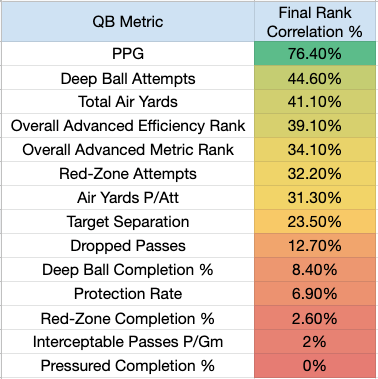
So, deep ball attempts and total air yards come out on top, which tells us that the more a QB is pushing the ball down the field, the better. While that shouldn’t shock anyone, what is also interesting to see if that it doesn’t even really matter how accurately they are pushing it down the field as deep ball completion percentage correlates just 8.4% of the time. Red-zone attempts are the third-most crucial individual metric and probably underutilized by a vast majority of the public in fantasy. This also makes sense as the more passes a QB is throwing near the end-zone, the more TD passes they’re going to throw overall. Rounding out the top five for QB are both the overall advanced-metric and advanced-efficiency ranks that I have compiled. This is essentially creating an average rank of all of a player’s advanced metric and efficiency ranks combined over the last three years. We’ll list those all below. You can also sort through QB advanced metrics on your own.
Deep-Ball Attempts
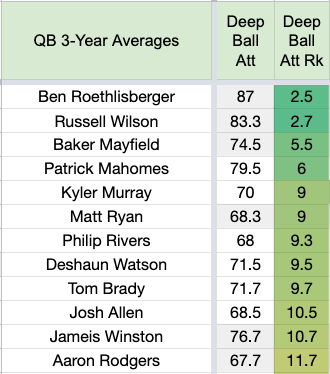
With deep-ball attempts correlating most closely to final ranks in fantasy, you could use that alone to argue that any of these guys belong in the QB1 tier. Baker Mayfield is impressive ranking third here. He also fell just outside the top 12 in total air yards ranking 13th.
The bottom 12 in this category with the worst listed first are:
- Drew Lock
- Teddy Bridgewater
- Dwayne Haskins
- Jimmy Garoppolo
- Marcus Mariota
- Cam Newton
- Ryan Tannehill
- Ryan Fitzpatrick
- Gardner Minshew
- Drew Brees
- Sam Darnold
- Mitch Trubisky
Total Air Yards
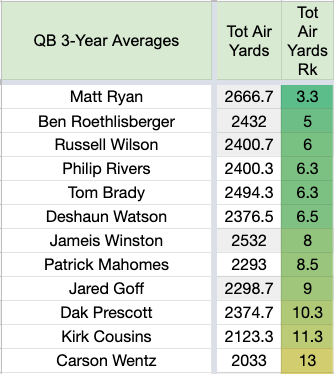
Some interesting new names creep into the list of air yards leaders that we don’t see in the deep-ball attempts leaders list with Jared Goff, Dak Prescott, Kirk Cousins, and Carson Wentz. This could hint that Goff and Cousins are undervalued heading into 2020 based on where they were being drafted.
The bottom 12 in this category of expected starters with the worst listed first are:
- Drew Lock
- Teddy Bridgewater
- Dwayne Haskins
- Ryan Tannehill
- Cam Newton
- Josh Allen
- Jacoby Brissett
- Mitch Trubisky
- Sam Darnold
- Tyrod Taylor
- Daniel Jones
- Aaron Rodgers
Red-Zone Attempts
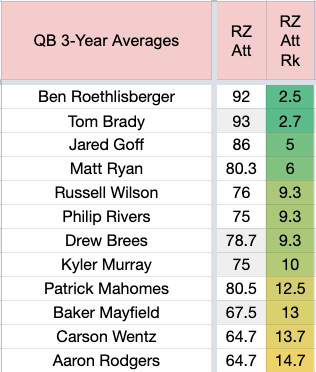
Goff moves up again in this list with the third-most red-zone attempts per season over the last three years on average. I promise this wasn’t meant to be a Jared Goff hype piece.
The bottom 12 in this category of expected starters with the worst listed first are:
- Dwayne Haskins
- Drew Lock
- Teddy Bridgewater
- Ryan Tannehill
- Josh Allen
- Lamar Jackson
- Ryan Fitzpatrick
- Sam Darnold
- Mitch Trubisky
- Deshaun Watson
- Tyrod Taylor
- Cam Newton
Overall Advanced Metric and Efficiency Ranks
The last step of this advanced metric research that I wanted to do was to compile all the data from the previous three years to give us a single, overall rank in both the advanced metric and advanced efficiency categories we have available on the site. As we showed earlier, these ranks correlated well to final ranks in fantasy, which could be used as a decent indicator for predicting future performance as well. Here are the leaders in both of those categories and how they have ranked in each stat over the last three years on average.
Three-Year Average Overall Advanced Metric Ranks
We saw most of these guys throughout the lists of metrics that correlated most closely with final ranks, but a few new names pop up. Ryan Fitzpatrick’s metrics combined between 2018 and 2019 are more impressive than he gets credit for. His INT issues continue to keep him from holding a starting role wherever he goes. Jimmy Garoppolo’s numbers are solely based on his 2019 stats, so a smaller sample size helps him here. Though his deep ball completion percentage ranked best amongst all QBs, he isn’t getting it done in the volume categories that are necessary to translate into fantasy success with poor showings in the total air yards and deep-ball attempt categories.
The bottom 12 in this category of expected starters with the worst listed first are:
- Dwayne Haskins
- Drew Lock
- Josh Allen
- Ryan Tannehill
- Sam Darnold
- Teddy Bridgewater
- Daniel Jones
- Gardner Minshew
- Mitch Trubisky
- Cam Newton
- Matthew Stafford
- Aaron Rodgers
Three-Year Average Overall Advanced Efficiency Ranks
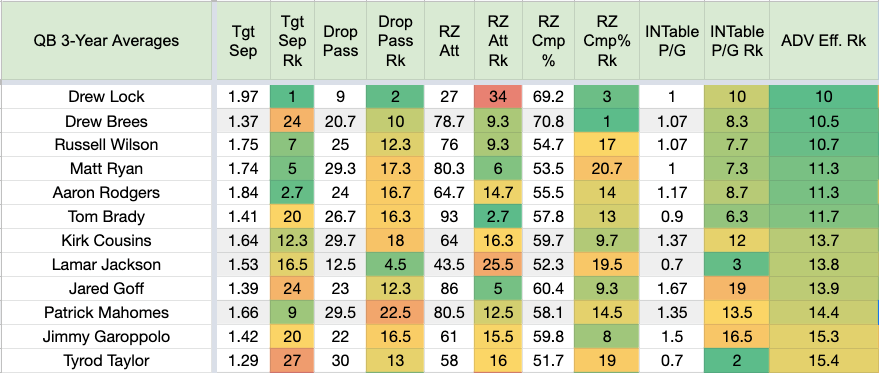
The overall advanced efficiency ranks correlated to the final ranks 39.1% of the time, slightly better than the overall advanced metrics categories (34.1%). The most important one here was RZ attempts. Drew Lock on top was certainly a surprise here. The only thing dragging him down was RZ attempts, which is no surprise given he didn’t play a full season, and it’s a volume-based stat. Lock didn’t rank very well in the other advanced metric categories; however, when looking at the less volume-driven stats like air yards per attempt (33rd) and deep-ball completion percent (31st). More volume could change that, though, and with the new weapons he has heading into 2020, it will be interesting to see how his advanced metrics change.
The bottom 12 in this category of expected starters with the worst listed first are:
- Gardner Minshew
- Daniel Jones
- Sam Darnold
- Dwayne Haskins
- Josh Allen
- Ryan Fitzpatrick
- Mitch Trubisky
- Matthew Stafford
- Dak Prescott
- Baker Mayfield
- Ryan Tannehill
- Ben Roethlisberger
Running Back
Here is a list of the advanced metric categories we will be analyzing for RB and their meaning.
- Snap Share: Percentage of total team offensive plays that the player was on the field.
- Opportunity Share: The percentage of the total team running back carries plus targets.
- Stacked Box %: Percentage of carries with eight or greater defenders in the box.
- Light Box %: Percentage of carries with six or fewer defenders in the box.
- Juke Rate: Isolates a running back’s on-field elusiveness and tackle-breaking power by dividing the total number of evaded tackles by the total number of touches (carries plus receptions).
- Evaded Tackles: Total number of unsuccessful tackle attempts by the defender.
- Total Yards Created and Yards Created per Game: All yards above and beyond what was blocked. Yards created are generated by the runner after the first evaded tackle.
- Breakaway Run Totals and Percent: Total carries of 15 or more yards.
- Fantasy Points per Attempt, Target, and Opportunity
- Total Drops
- Drop Rate
Which Metrics Matter the Most?

Dominate Your Fantasy League!
Become a member at FantasyData and get access to the industry’s best fantasy subscription available!
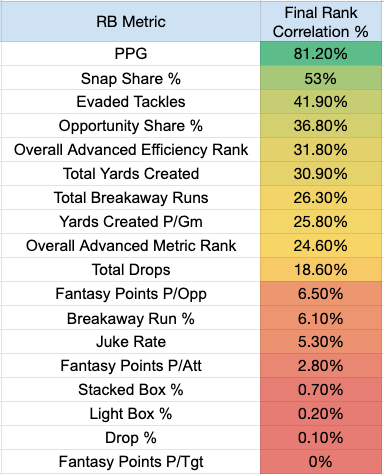
Aside from PPG, it’s all about opportunities for RBs. Snap share and opportunity share are pretty similar stats, so seeing them ranked together makes sense. I am impressed to see that evaded tackles rank so highly here. As a whole, both the advanced efficiency and metric ranks aren’t quite as strong at RB as they are with QB, but we also have more consistent samples from the QBs and a more significant number of RBs as well, which drags the rankings down a bit.
Let’s take a look at the list of active RBs and how they have fared over the last three years in these top ranks that correlated most closely. For RB’s, I have noted which years they qualified to have advanced metrics analyzed if it wasn’t all three years. You can also sort through RB advanced metrics on your own.
Snap Share %
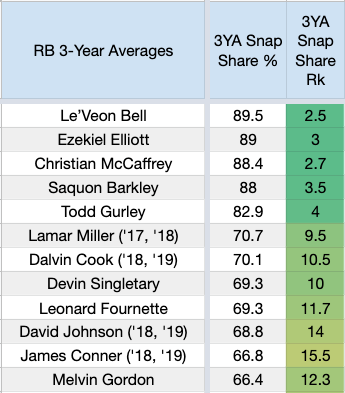
No doubt you’re going to see a lot of bell-cow backs on this list. Devin Singletary stands out as an exciting name heading into the 2020 season. If he can keep that snap share above 66%, he could have a shot at a top-12 finish.
The bottom 12 in this category with the worst listed first are:
- Matt Breida
- Jalen Richard (’18, ’19)
- Raheem Mostert (’19)
- Gus Edwards
- Sony Michel
- Ronald Jones (’19)
- Nyheim Hines
- Peyton Barber
- Latavius Murray
- Royce Freeman
- Jaylen Samuels (’19)
- Tarik Cohen
Evaded Tackles
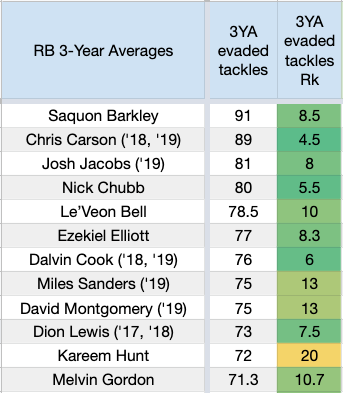
I haven’t been very high on Chris Carson before diving into this, but his evaded tackle numbers are impressive. Dion Lewis is a fun blast from the past and a reminder of how quickly RBs disappear from relevance in fantasy.
The bottom 12 in this category with the worst listed first are:
- Jaylen Samuels (’19)
- Chris Thompson
- James White
- Jalen Richard (’18, ’19)
- Nyheim Hines
- Gio Bernard (’17, ’18)
- Matt Breida
- Jamaal Williams
- Kerryon Johnson
- Tarik Cohen
- Gus Edwards
- Royce Freeman
Opportunity Share %
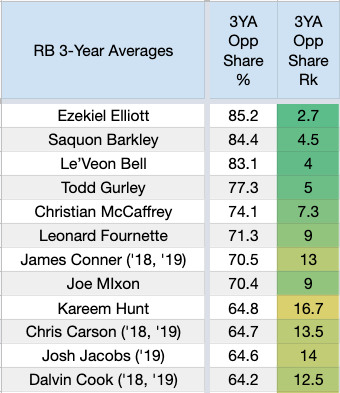
More of the same we saw from the snap share percent. Joe Mixon sneaks his way into this list.
The bottom 12 in this category with the worst listed first are:
- Jalen Richard (’18, ’19)
- Nyheim Hines
- James White
- Duke Johnson
- Raheem Mostert
- Jaylen Samuels (’19)
- Matt Breida
- Tarik Cohen
- Chris Thompson
- Gio Bernard (’17, ’18)
- Royce Freeman
- Gus Edwards
Suppose someone would only give Duke Johnson more opportunities! That’s been the story of his career. The rest of these guys are more role players on offense and pass-catching RBs.
Three-Year Average Overall Advanced Efficiency Ranks
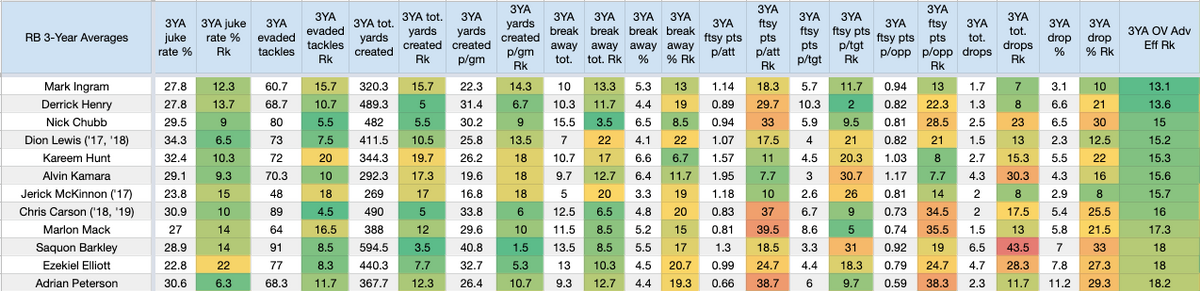
There’s a lot to take in with the advanced efficiency ranks for RB! I bet you didn’t think you’d see Mark Ingram at the top either, but there he is. He has been just outside the top 12 in most categories but not very far off in pretty much all of them. Jerick McKinnon only having a one year sample from 2017 as his most current decent body of work tells you all you need to know about him, but he was one of the most efficient that season. Marlon Mack hanging out on this list is impressive, given all the love people have showered onto newcomer Jonathan Taylor. Last but not least, Adrian Peterson continues to chug along and leave behind substantial numbers. He had 77 evaded tackles in 2019, which tied with Alvin Kamara for 11th most in the league.
The bottom 12 in this category with the worst listed first are:
- Jaylen Samuels (’19)
- Nyheim Hines
- Royce Freeman
- David Johnson (’18, ’19)
- Jalen Richard (’18, ’19)
- Sony Michel
- Kerryon Johnson
- Phillip Lindsay
- Chris Thompson
- Jamaal Williams
- Peyton Barber
- Damien Williams (’19)
These are mostly the same guys we saw that didn’t fare well in the three most important categories. David Johnson is a surprising name to pop up, though. It’s funny to see his name as we are preaching for Duke Johnson to get more opportunities. Phillip Lindsay is an interesting case. He’s known for being able to break off big runs, and his breakaway run total supports that as he’s ranked 12th in the league in that category over the last two years. The thing is, he doesn’t make people miss tackles at a high rate. He’s averaging 45 evaded tackles per season over the last two years, which ranks 26th. In turn, he’s also not creating yards at a high enough clip to make up for it.
Three-Year Average Overall Advanced Metric Ranks
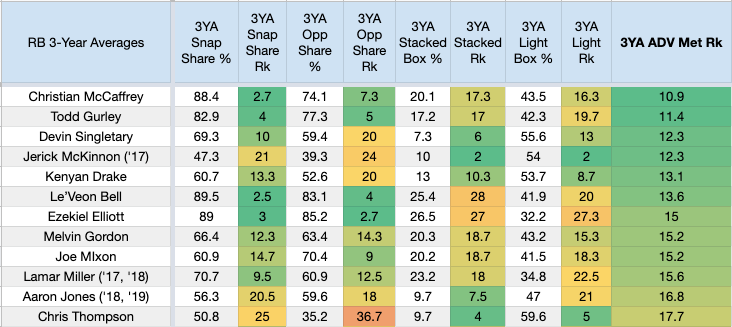
The overall advanced metrics didn’t correlate to final ranks very strongly at RB simply because stacked and light boxes don’t matter for fantasy purposes, at least. Sure, it would be great if your RB faced a light box every snap as opposed to seeing eight men in the box, but it hasn’t been impactful when it comes down to fantasy points. Despite this, you still have to like seeing a guy who is combining a strong showing in the snap and opportunity share columns while also getting lighter boxes. The only two guys you find inside the top 12 here that have had that opportunity is Devin Singletary and Kenyan Drake. It’s almost always one or the other here. You either get more opportunities and less favorable boxes, or you’re getting fewer opportunities and more favorable boxes, which is usually the case for the scatback types.
The bottom 12 in this category with the worst listed first are:
- Raheem Mostert
- Ronald Jones (’19)
- Jaylen Samuels (’19)
- Royce Freeman
- Sony Michel
- Matt Breida
- Latavius Murray
- Gus Edwards
- Peyton Barber
- Phillip Lindsay
- Jalen Richard (’18, ’19)
- Derrick Henry
Unless you’re Derrick Henry, this is where you don’t want to live as an RB. These guys are seeing unfavorable snap and opportunity shares and loaded boxes even when they do see action. If you’re asking, “why is Derrick Henry even on this list? He’s an every-down back.” That only became somewhat true last season. Before that, he only saw around a 42% snap share, and 47% opportunity share the previous two years. Ronald Jones is another intriguing name on this list whose fortune could change in 2020. Defenses weren’t afraid to bum rush Jameis Winston knowing that forcing him to throw meant a chance at a turnover on almost every play. In turn, this created loaded boxes for RoJo.
On top of that, he couldn’t get passed the RBBC approach to the backfield. That may not change this season, but with Tom Brady under center, you better believe RoJo will get more favorable fronts. Unfortunately, as this study also shows, that alone rarely leads to more fantasy production, and his ranks in the evaded tackles (24th) and yards created categories (22nd in total yards, 26th in p/gm) is nothing to write home about.
Wide Receiver
Here is a list of the advanced metric categories we will be analyzing for WR and TE and their meaning.
- Hog Rate: Represents targets per snap to capture the rate of passing game utilization on a per play basis.
- Snap Share %: Percentage of total team offensive plays that the player was on the field.
- Air Yards (Total, P/Gm, P/Rec, and P/Tgt): Air yards are total completed receiving yards from the line of scrimmage to the catch point.
- Target Accuracy: Grades the accuracy of each target on a 1-4 scale. 1 representing the least accurate, and 4 representing the most accurate passes. Target Accuracies above 3.0 are excellent, and those below 2.0 are highly errant.
- Target Share: Measures the percentage of all team passing targets directed at a particular wide receiver.
- Cushion: Average cushion afforded to the receiver by his assigned defender on each route run.
- Target Separation: A receiver’s average yards of separation distance from the closest defensive back at the moment the target arrives.
- True Catch Rate: Divides total receptions by total catchable targets.
- Contested Targets, Receptions, and Rate: Plays where the defender is in range and contests the pass at the catch point.
- Total Drops and Rate: Catchable passes that the receiver dropped.
- Yards per Reception
- Yards per Target
- Yards per Route
- Total Targets
- Red-Zone Targets
- End-Zone Targets
- Fantasy Points per Target
Which Metrics Matter the Most?
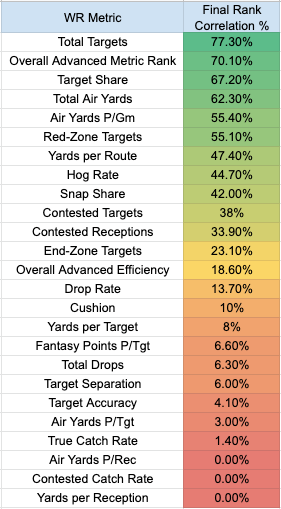
PPG rank isn’t included in the table, but it correlated at 84.3% for WR. The volume of targets paves the way here with total targets and target share, both ranking top three. The custom overall advanced metric rank performs exceptionally well for WR; we’ll cover that more below. After those, we see a similarity with QB metrics as total air yards round out the top five. Yards per route ranking highly was impressive to see, mainly because I think we see yards per reception or target used relentlessly in a lot of content, but the one that we should be paying the most attention to of those three is yards per route. Red-zone targets ranking highly over end-zone targets was something else that caught my eye. It makes sense when you break it down. There are a higher number of red-zone targets; therefore, more fantasy points are coming from that category than end-zone targets.
The overall advanced efficiency rank takes a bit of a beating for WR, especially considering how strongly the advanced metric rank section performed. If you’re in a pinch and need to quickly glance at stats to get an idea of how well a player is performing, our advanced metric tab is the place to look over the efficiency tab.
The last note I took away from these is that there are a lot of “sexy stats” that people toss around a ton to support a player’s fantasy potential, but it turns out, some of them have hardly any impact on a player’s final rank. I’m looking at the cushion, target separation, true-catch rate, and contested-catch rate that fit this bill. While these are significant indicators of a player’s talent, but they wind up impacting fantasy performance on an incredibly small scale. On the opposite end of that, we see that total drops, although embarrassing and an excellent way to lose the trust of your QB, have little to do with a player’s final rank in fantasy.
Let’s take a look at the top players in some of the categories that correlated most closely to final ranks over the last three years. You can also sort through WR advanced metrics on your own.
Total Targets
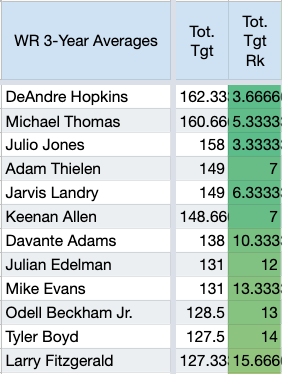
Total targets shouldn’t have too many shocking names as these guys have been staples of fantasy rosters for years, for the most part. Jarvis Landry is one of my favorite wideouts every season for this very reason, and he is ADP has been a screaming value in the last few years. Tyler Boyd is an intriguing name amongst all of these studs. The early portion of Larry Fitzgerald’s three-year sample is supporting his dropped numbers from 2019 just enough to keep him in the top 12. Some notable names just outside the top 12 include (in order) Allen Robinson II, Robert Woods, DJ Chark Jr., Kenny Golladay, and Jamison Crowder.
The bottom 12 in this category with the worst listed first are:
- Seth Roberts
- Tyrell Williams
- Breshad Perriman
- Anthony Miller
- Willie Snead IV
- Hunter Renfrow
- Marquise Brown
- Chris Conley
- Sammy Watkins
- Russell Gage
- Kenny Stills
- Keelan Cole
These guys all accrued enough targets to qualify for advanced metrics. I quite like a couple of them from this list for the 2020 season like Perriman, Miller, Brown, and Stills. They all could potentially see a boost in volume and have big-play potential, but without volume, they will have a hard time succeeding.
Target Share
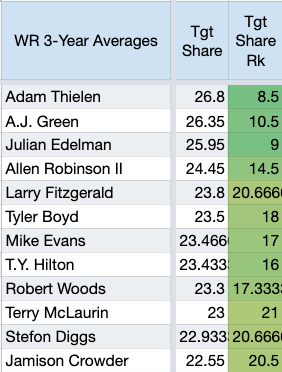
Target share tells us how a player dominates targets specifically on his team, so we see a small shift here compared to total targets. Thielen on top is interesting to see especially considering that Stefon Diggs (who ranked 11th here) has left town. That share percent for Thielen has a good chance of standing firm. Robert Woods is another guy like Jarvis Landry who is continuously performing but never really gets full credit for his performances. Crowder breaks onto this list inside the top 12. It’s hard to love anyone on the Jets in fantasy with Adam Gase at the helm, but Crowder has been a core part of his offenses when healthy.
The bottom 12 in this category with the worst listed first are:
- Demarcus Robinson
- Bisi Johnson
- Chris Conley
- Russell Gage
- Breshad Perriman
- Seth Roberts
- Anthony Miller
- Steven Sims Jr.
- Albert Wilson
- Allen Lazard
- Tyrell Williams
- Mike Williams
These guys have mainly been depth pieces. Perriman could be thrust into a larger role. Unfortunately, it’ll be with the Jets. Miller has struggled to stay healthy, and then he’s had to deal with Trubisky as his QB. That’s a double whammy.
Total Air Yards
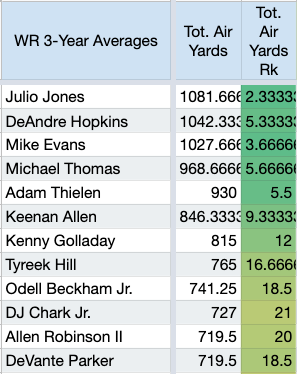
The big dogs continue to eat in the air yards category. Julio Jones has been one of the most impressive wideouts in the league for years, and his consistency in final ranks and categories like total air yards are dominating. Chris Godwin may be the favorite wideout on the Bucs for most fantasy managers, but when it comes to air yards, Mike Evans should be your guy. He finished first in total air yards in 2018 and remained in the top five in 2017 and 2019. While Tom Brady may not chuck it as often as Jameis Winston did, the role and lead in team air yards should remain the same for Evans. You would think Tyreek would be a little higher on this list, but the combination of missed time and his slight boom/bust ways bring his gross totals down a little.
The bottom 12 in this category with the worst listed first are:
- Steven Sims Jr.
- Albert Wilson
- Bisi Johnson
- Randall Cobb
- Russell Gage
- Willie Snead IV
- Hunter Renfrow
- Seth Roberts
- Adam Humphries
- Deebo Samuel
- Demarcus Robinson
- Sammy Watkins
Again, primarily guys who have bit roles on offense but are sometimes thrust into larger roles due to injury. Also, some slot guys who you wouldn’t expect to see a lot of air yards.
Overall Advanced Metric Ranks
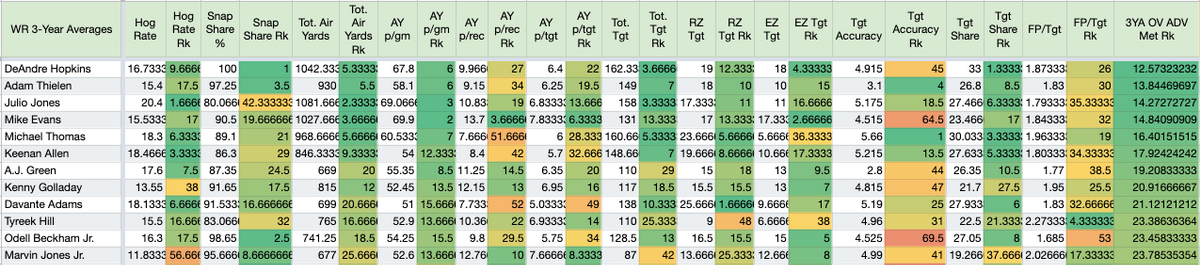
So, here is an excellent look at the top 12 players in overall advanced metrics over the last three years and their average stats. The biggest surprise to me on this list is Marvin Jones Jr. creeping into the top 12. I have always been a pretty big Marvin Jones Jr. guy, but this solidified that even more. When you look at Jones’s stats side-by-side with those of Kenny Golladay, it’s pretty incredible how identical they are. The only thing Golladay is beating him in is total targets.
This view kind of puts into perspective how unimportant QB accuracy is for WRs. It also shows you how fantasy points per target don’t match well either.
Overall Advanced Efficiency Ranks
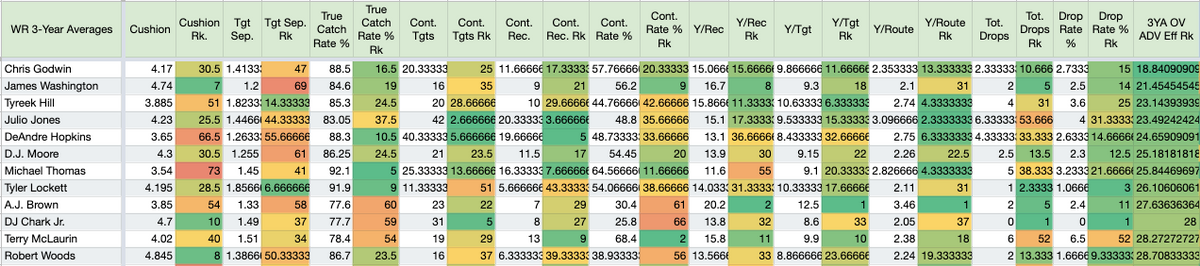
Even though the overall WR advanced efficiency ranks didn’t fare too well in the correlation department, it’s still worth sharing since this was a big part of this project for me. Yards per route was the most vital stat here and could be supporting evidence that A.J. Brown could continue to grow into an elite wideout. We also see this section kind of muddied by guys who have only one-year samples to analyze. James Washington is one of those guys, but his stats do stand out. Most notably, when comparing his stats to those of fellow wideout Diontae Johnson. Advanced mets like Washington better, which make him intriguing on a Steelers depth chart with a lot of questions.
Tight End
Which Metrics Matter the Most?
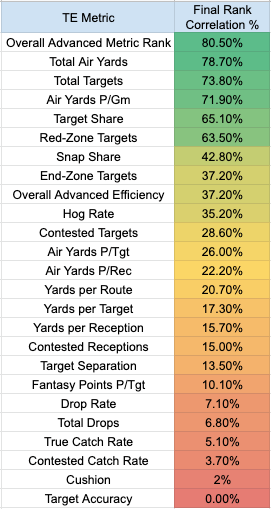
This is what I wanted to see. The custom overall advanced metric rank is sitting on top. This means that creating one overall rank for TE of all of their metric ranks combined correlated most closely to their final ranks in fantasy. The overall advanced efficiency numbers also fared better at TE than they did at WR. Something else I was excited to see here was the difference between WR and TE. There isn’t that much of a staggering difference when it comes to the order in which these are most important. Total air yards beat out total targets ever so slightly. Yards per route is a much stronger indicator of fantasy success for WR (47.4%) than it is for TE (20.7%). The same goes for contested receptions with a 33.9% rate for WR compared to just 15% for TE. Target separation, drops, true-catch rate, contested-catch rate, cushion, and accuracy continue to almost be a non-factor.
Let’s take a look at the top players in some of the categories that correlated most closely to final ranks over the last three years. You can also sort through TE advanced metrics on your own.
Total Air Yards
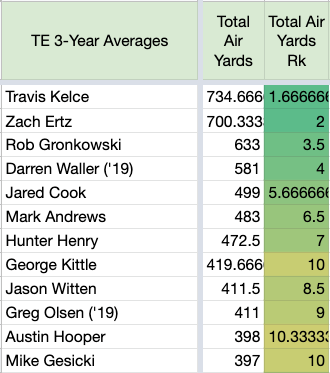
You know you’re going to see a lot of Travis Kelce on top of everything. Just expect it. The top three here really have a substantial lead in total air yards with Kelce, Ertz, and Gronk. There is so much more of a definitive tier at TE right now than there is at WR. It remains to be seen if Gronk remains in that tier, but Kelce and Ertz do based on their volume alone. Outside of that, Jared Cook is an interesting name to round out the top five in total air yards.
The bottom 12 in this category with the worst listed first are:
- Jonnu Smith (’19)
- Nick Boyle
- Vance McDonald (’18, ’19)
- Jordan Akins (’19)
- T.J. Hockenson
- Irv Smith Jr.
- Ian Thomas (’18)
- Gerald Everett (’18, ’19)
- Darren Fells (’19)
- Dallas Goedert
- Blake Jarwin (’19)
- C.J. Uzomah (’18)
Raise your hand if you knew that Nick Boyle (the other Ravens TE, in case you didn’t know) had more air yards than Jonnu Smith in 2019. I didn’t before digging through this. That’s not a good thing for Jonnu. All the athleticism in the world isn’t going to save him from doom in fantasy if they don’t start putting a little air under the ball when passing to him. Dallas Goedert is another interesting name at the bottom of this list, considering Ertz sits near the top.
Total Targets
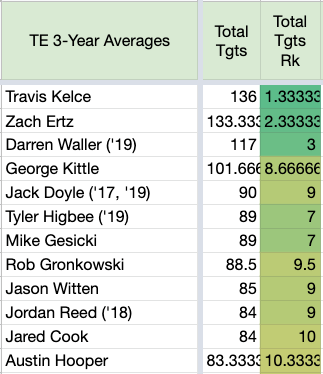
Darren Waller tried to push himself into an elite company in 2019 with his massive target total. All signs point towards regression in 2020. Jack Doyle just needs to stay healthy to be able to stay near the top of the league in targets in the Colts TE-friendly offense. We need a larger sample from guys like Tyler Higbee and Mike Gesicki to know if they can truly break into a top tier consistently, but they’re on the right path with these target totals so far.
The bottom 12 in this category with the worst listed first are:
- Blake Jarwin (’19)
- Nick Boyle
- Jonnu Smith (’19)
- Irv Smith Jr.
- Darren Fells (’19)
- Ian Thomas (’18)
- O.J. Howard
- Jordan Akins (’19)
- Gerald Everett (’18, ’19)
- Chris Herndon (’18)
- T.J. Hockenson
- Vance McDonald (’18, ’19)
Boyle may have had more air yards than Jonnu, but Jonnu at least saw more targets. Wait… that’s not a good thing! Most of these guys are backups or players with injury issues. The only one of these guys that has a substantial overall advanced metric rank is Chris Herndon, whose best metric ranks were air yards per target (5th) and air yards per reception (6th) in 2018. If he can get more volume and maintain those numbers, he would be in much better shape.
Air Yards per Game
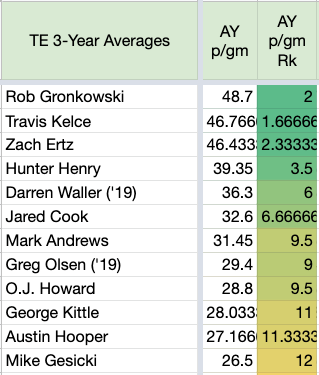
We don’t see too much change here from the total air yards category except that O.J. Howard replaces Jason Witten on the leaderboard. If the Bucs do run more two-TE sets and Howard can get back to his pre-2019 form, he could turn some heads. Again, we see a decent divide between the top three and the rest of the pack, and the volume on a per-game basis is pretty low overall, so it doesn’t take much yardage-wise for a TE to make a difference.
The bottom 12 in this category with the worst listed first are:
- Jonnu Smith (’19)
- Nick Boyle
- Jordan Akins (’19)
- Vance McDonald (’18, ’19)
- Darren Fells (’19)
- Irv Smith Jr.
- Blake Jarwin (’19)
- Dallas Goedert
- Gerald Everett (’18, ’19)
- T.J. Hockenson
- C.J. Uzomah (’18)
- Noah Fant
Again, not much change from the total air yards category, but we see Noah Fant come into the conversation. The Broncos simply weren’t pushing the ball downfield in 2019, but we saw some flashes from Fant that could hint that he’s capable of much more if the offense wasn’t so vertically challenged.
Overall Advanced Metric Ranks
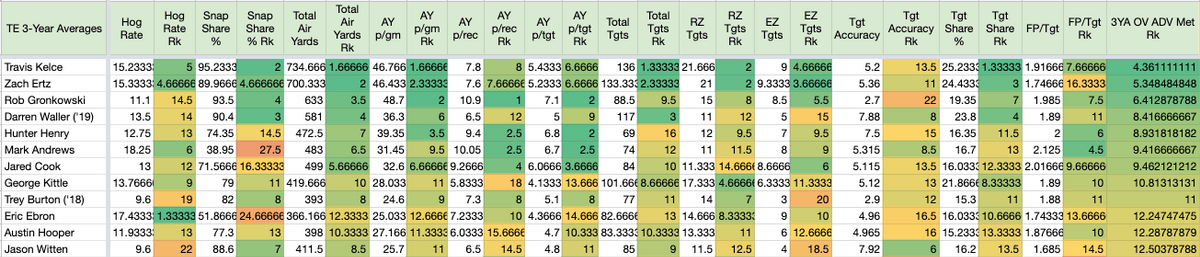
This lays it all out for you at TE. We have seen a lot of these names already through the filters of the top stats, but there are a couple of guys who sneak into the overall ranks. The two that stick out to me that are my favorites for sleeper picks are Trey Burton and Eric Ebron. Burton has just one year in 2018, where he put up some excellent numbers, but he hasn’t been able to do much since. His injuries woes have already crept up on him as well, which could hinder him again all season. Ebron led all TEs in TDs just two years ago, but everyone has cast him aside. I’ll take that kind of upside all day, especially now, with him joining the Steelers.
Overall Advanced Efficiency Ranks
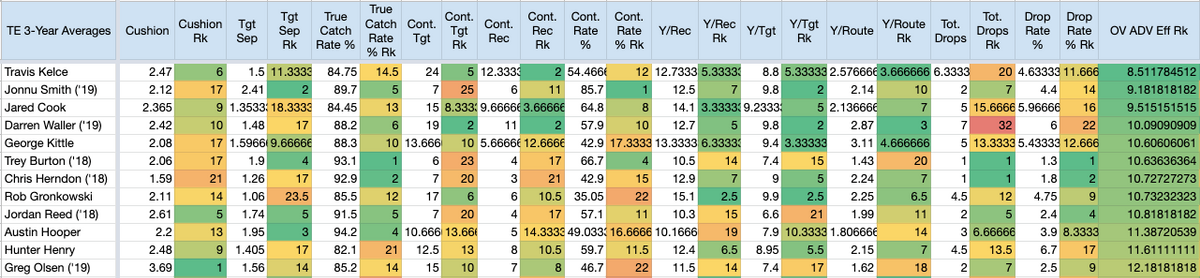
Finally! A section where Jonnu Smith stands out. Unfortunately, he excels in all the categories that don’t matter for fantasy. You could use this as an argument that they need to get him the ball more. Which I agree with, I like Jonnu. But we have also seen that with the lower volume sometimes comes higher efficiency numbers. Once you start seeing higher volume, the efficiency can tend to regress to the mean unless you’re uber-elite like Travis Kelce. The same argument could be made for Chris Herndon. Unfortunately, Gase doesn’t do volume, so that one will probably have to wait.
Conclusion
Here is a quick look at all the stats together to use as a quick reference guide.
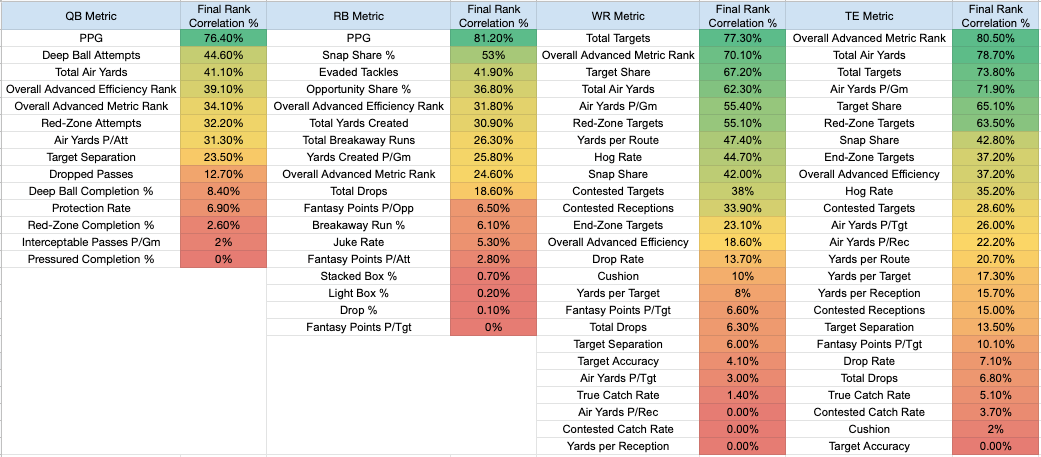
Anytime you’re looking into research for how to find out who is going to score more fantasy points, the answer is always volume. But now, with so many different measurements of volume, it’s equally important to know which ones to trust. That was basically what this study was all about. Finding out which players were the best across the board when it came to advanced metrics and which individual metrics we should trust. I hope you take away a lot from this as it took a very long time to put together and use it as a reference throughout your season. There is a lot to take in, so feel free to hit me up on Twitter if you want to chop it up a little bit more. Thanks and good luck!