This Fantasy article was created from Data and Statistics provided by FantasyData. If you would like to get your hands on research tools or even an API feed to create your own personal data, click here and signup today!
Fantasy Breakdown: Opportunity and Efficiency
The rapid-fire nature of the Fantasy Football season has given way to an opportunity to breathe, let the dust settle, and dig into a full NFL year of data while it’s still relatively fresh. There are many directions one can travel up this mountain of data. In this article, I will be looking at some useful metrics for wide receivers that showcase two drivers of fantasy production: opportunity and efficiency.
On the surface, volume and production drive fantasy scoring. Receptions, yards, and touchdowns directly produce fantasy points and obviously should not be overlooked or ignored. But they only tell a piece of the story and are relatively less predictive than some other metrics available to us. Many different contexts begin to materialize once you start digging a little deeper.
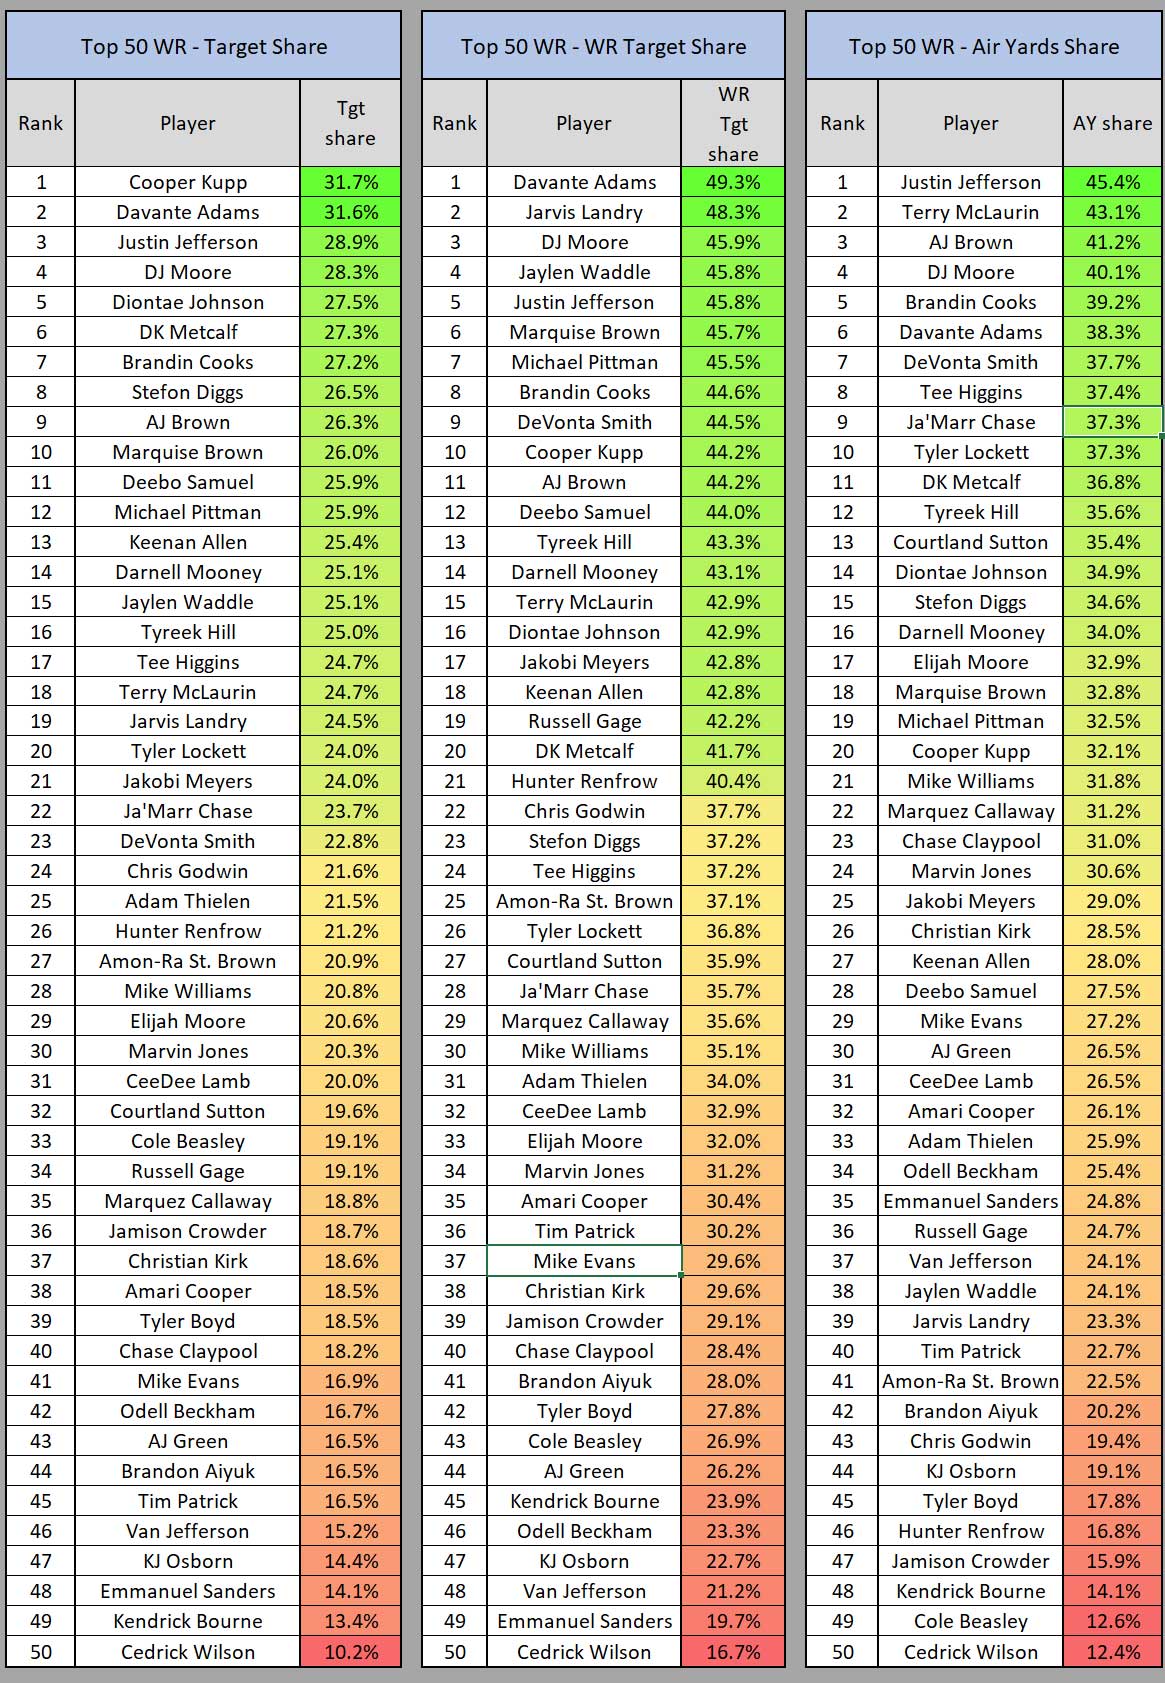
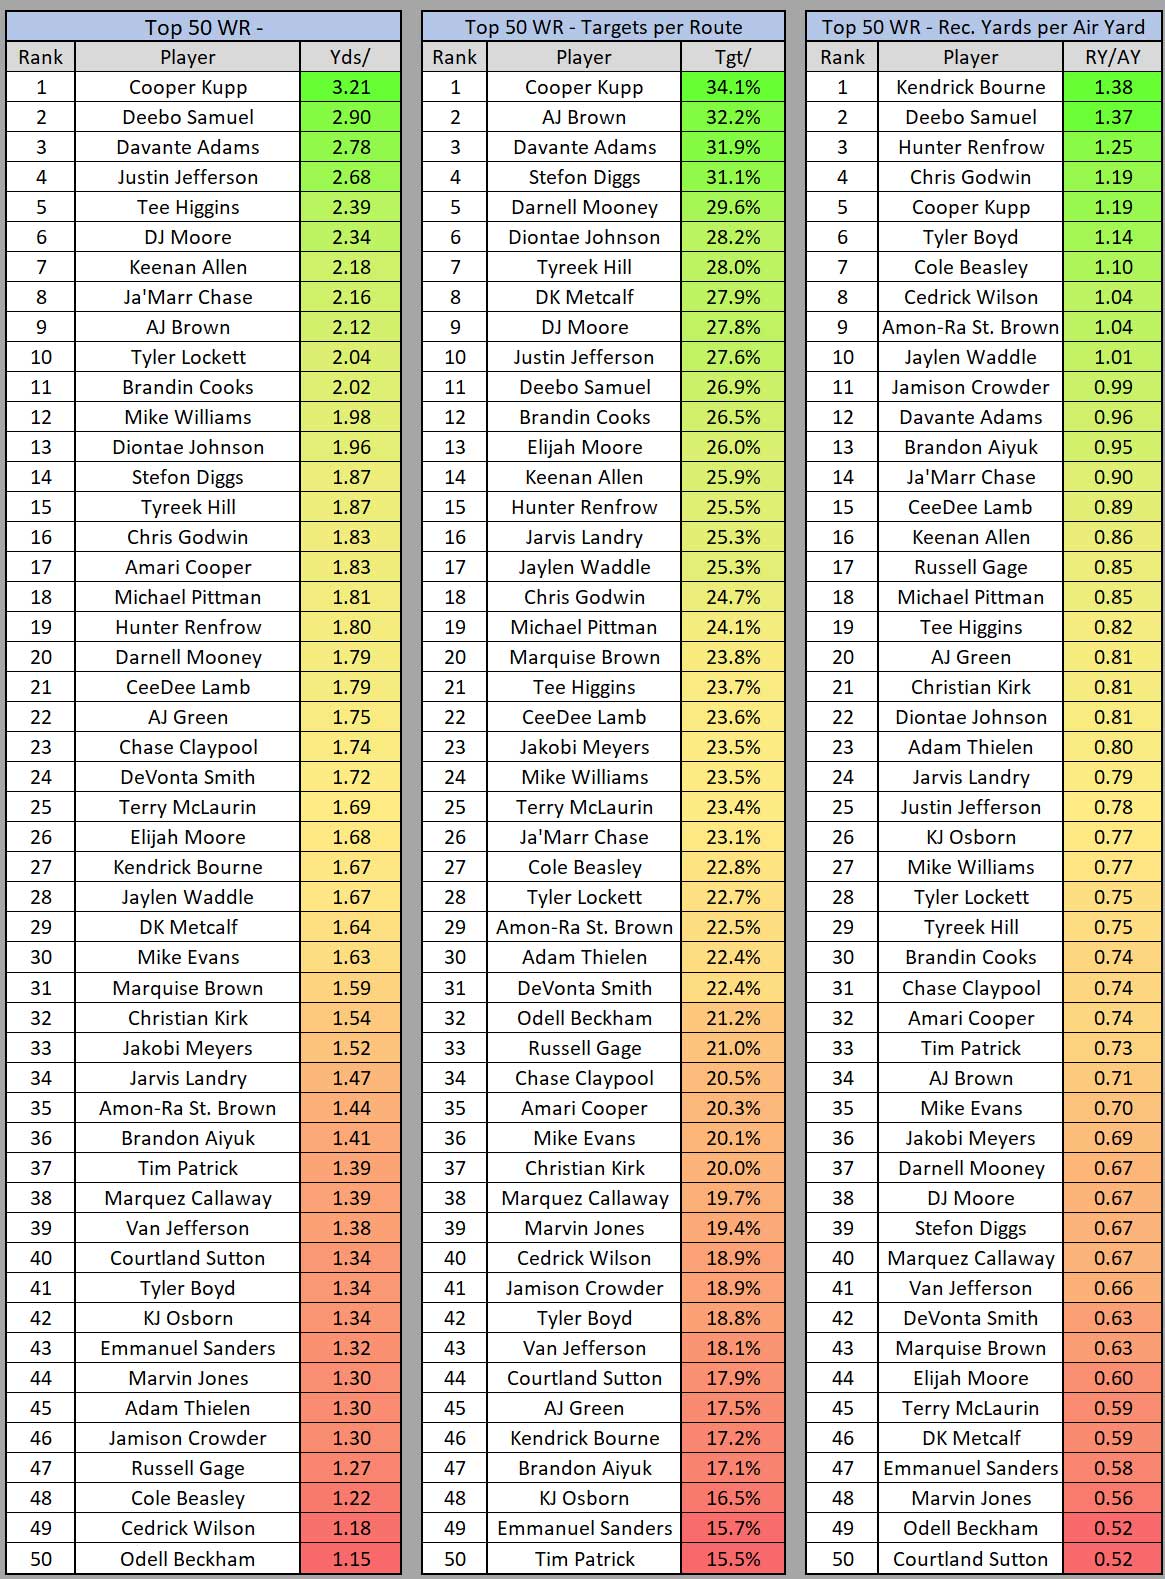
Wide receiver market share statistics, such as target share, wide receiver target share, target rate (targets per route), receiving yards per team pass attempt (RY/TPA), and air yards share are some of the available metrics that effectively measure a player’s opportunity, with air yards additionally as a good indicator of the level of intent to get the ball in a receiver’s hands. Receiver Air Conversion Ratio (RACR), which measures the number of receiving yards created for every air yard, is a great measure of a player’s efficiency once they’ve earned the opportunity (target) from the QB. RACR is also important because it ties in yards after the catch (YAC). Low air yard players like Chris Godwin and Deebo Samuel will in turn have a low air yard share, but both have a high RACR, which is why you cannot look at something like air yard share by itself.
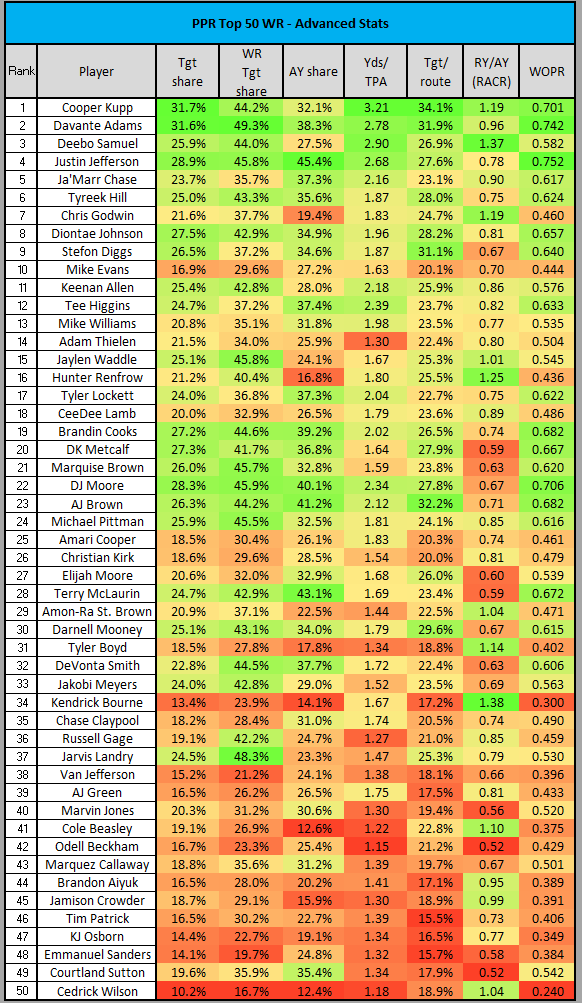
This is typically where I begin my offseason research because opportunity and efficiency are prerequisites for volume and production, respectively, and tend to be more predictive over larger sample sizes than statistics like total yards, targets, etc. The chart below shows the statistics discussed above for the 2021 Top 50 WRs (PPR format; ppg basis).
This chart provides a snapshot of the 2021 season for these peripherals. Reorganizing the data, sorted by fantasy points per game, gives a better visual of how each player finished.
There is plenty to digest here. For this article, I chose to discuss two players that stand out as being somewhat out of place based on this data. I added columns to this chart showing how each player scored their fantasy points (%FPTS from receptions, %FPTS from yards, and %FPTS from touchdowns) along with TD% (touchdowns per target).
Mike Evans (TB)
Mike Evans finished as the WR10 on the season with 16.4 PPR points per game in 16 games. You can see in the chart above that Evans put up below-average numbers across the board:
- Target share: 16.9% (41st)
- WR target share: 29.6% (37th)
- Air yards share: 27.2% (29th)
- Target rate: 20.1% (36th)
- RY/TPA: 1.63 (30th)
- RACR: 0.70 (35th)
A common explanation for Evans’ low numbers would be the “too many mouths to feed” debate. But targets are earned. Granted, on paper, the Buccaneers’ pass-catching group was loaded with talent. However, while Evans played in 16 of 17 games, Godwin, Brown, and Gronkowski combined to miss a total of 17 games. A sub-20% target share and sub-30% WR target share look even worse within that context. Also, you ideally want to see a high number for at least one of air yards share or RACR. A low air yards share with a high RACR indicates the receiver is not being targeted very deep but is efficient with the air yards and doing damage with YAC. A high air yards share with a low RACR indicates deeper targets, where YAC are much less likely. Being bottom half in both, which is the case with Evans, typically would not translate to a WR1 season.
But there are no absolutes in fantasy analysis. These metrics are not end all be all. Despite Evans finishing outside the Top 30 for most of these statistics, he still finished as a WR1 in fantasy points per game. The important next question is how?
The simple but incomplete answer is touchdowns. Evans’ 12.3% TD% and %FPTS from TDs (32.0%) both lead the league. We can hardly fade a player simply because they score a lot of touchdowns. That’s crazy. What needs to be assessed is the likelihood this relatively disproportionate reliance on TDs is repeatable. In 2020, Evans scored 13 TDs on 109 targets for an 11.9% TD% (3rd highest). In 2021, Evans scored 14 TDs on 114 targets for a 12.3% TD%. Prior to 2020, Evans’ career TD% was 5.7%. I made the mistake of fading Evans coming into the 2021 season based solely on this TD% jump from 5.7% to 11.9%, incorrectly ignoring the fact that this jump coincided with Tom Brady becoming his QB in Tampa Bay. With Brady, the Buccaneers easily led the league in pass volume this season (714 passes, 43.3 passes per game). This was a major contributing factor in Evans locking up his 8th straight 1,000-yard season despite a 16.9% target share. Evans finishing as a WR1 was largely based on touchdowns and his market share numbers (as low as they were) being a share of a league-leading passing market.
We are at a point in the offseason steeped in uncertainty. Tom Brady retired. We don’t know who the QB will be if it is not Kyle Trask. Godwin and Gronkowski are both unrestricted free agents potentially moving elsewhere. And Evans will turn 29 years old on August 21, right on the edge of what has been shown to be an age cliff in fantasy production.
% of top-12 fantasy producers (PPR) by age over the last 10 years pic.twitter.com/PTySzVXBq5
— Ian Hartitz (@Ihartitz) February 8, 2022
Evans could easily put up another 1,000-yard season and sneak into the top 12 again. Believe me, it’s hard to bet against him. But you also cannot be blinded by his career accolades. Eight straight 1,000-yard seasons is elite, and Evans is extremely talented. But that is not a reason to ignore these numbers, which are pointing at the potential for a downslope. Any downtick in his TDs or the team’s overall passing volume, combined with these 2021 peripherals could mean a relatively disappointing season for Evans in 2022.
D.J. Moore (CAR)
D.J. Moore is on the other side of this spectrum. Moore finished as the overall WR22 with 14.0 PPR ppg in 17 games. You can see a different picture with Moore’s peripherals:
- Target share: 28.3% (4th)
- WR target share: 45.9% (3rd)
- Air yards share: 40.1% (4th)
- Target rate: 27.8% (9th)
- RY/TPA: 2.34 (6th)
- RACR: 0.67 (38th)
In the second chart, Moore is mostly green across the board, like the Top 6 WRs, but barely finished as a WR2 in points per game. This is partially due to a lack of TDs. Moore also finished with a low RACR, but this makes more sense due to Moore’s 3rd highest air yard share (higher air yards usually means lower RACR). For reference, only one WR had an air yard share above 30% and a RACR above 1.0 (Cooper Kupp).
The other contributing factor was the opposite of Evans’ situation. Moore’s Top 5 market share numbers were part of a smaller and much less efficient passing market in Carolina. The Panthers were 14th in the league in pass attempts per game (35.2), so middle of the pack, right? Not quite. Any semblance of a successful passing attack starts and stops with a 14th ranked pass attempts per game. Beyond that, the following were just a few of the Panthers’ passing statistics that tell the story.
- Completions per game: 20.5 (25th)
- Yards per pass attempt: 6.0 (31st)
- 3rd Down Conversion rate: 35.7% (29th; not strictly a passing statistic, but an offense’s success in extending drives is an important factor in a pass catcher’s opportunity)
Coupled with Carolina QBs finishing the season with a 58.1% completion rate (tied for last with the Saints) and 0.67 TD/INT ratio (21 INTs thrown, which was dead last), you see how the passing market from which Moore’s market share numbers were derived was one of the worst in the league.
Moore’s catch rate was only 57.4% but a higher aDOT always corresponds to a lower catch rate. Moore has never scored more than 4 receiving TDs in a season so I’m not expecting a significant increase in TDs (not everyone can have Tom Brady take over at QB), but his situation only has one direction it can go: up. With D.J. Moore and his excellent peripheral opportunity metrics, even a slight uptick in TDs and an entirely plausible improvement in QB play and team passing efficiency would bode very well for him in 2022.
The purpose of this article is not to rank these two wide receivers or choose between the two. The projections and rankings I’ll be doing for redraft formats are months away. The purpose is to show two players who had different results both in fantasy points per game and these advanced opportunity/efficiency metrics to determine why; to enlarge the context in an effort to make the best prediction possible as to the probability of future results.
Win Your Fantasy League!
Become a member at FantasyData and get access to the industry’s best fantasy football subscription available!


