Fantasy Football Beneath the Surface: 2022 Season Recap Part 1
Another season of NFL football, another pile of data to sift through looking for clues. Clues as to what leads to certain results and clues for speculating what might be coming next. They say, “looks can be deceiving.” The same can be said for surface-level statistics in fantasy football. During the 2022 NFL season, this weekly article series looked beneath the statistical surface, beyond the standard box score, using the premium statistics provided by FantasyData, including advanced and efficiency metrics across the fantasy skill positions, to search for puzzle pieces that fit together. I will be continuing the “Beneath the Surface” series with multiple “2022 Season Recap” articles during the offseason.
The metaphorical dust has settled on the 2022 fantasy football season. There are many important and interesting forward-looking topics, like incoming rookie prospects, the year-long grind of dynasty formats, NFL Draft content, and speculation about free agency and potential trades (to name a few). And I will be delving into each of these topics as the offseason progresses. But I find it important to put the 2022 season under the statistical microscope while it is still somewhat fresh in my mind. In this “2022 Season Recap” series, I will be looking beneath the statistical surface across each fantasy football skill position in order to add important context to the season-long numbers most will come back to during the summer as the 2023 season gets closer.
In the first few articles, I will be looking at the concept of consistency, specifically in the scoring of fantasy points across the four skill positions (QB, RB, WR, and TE). There are multiple ways in which season-long fantasy scoring is measured. Using total fantasy points scored is common. After all, fantasy points are what win fantasy matchups, so calling the player with the most fantasy points the “#1” at that position makes sense, on the surface. One issue with using total points is it skews the leaderboard and can disproportionately reward simply avoiding injury. Yes, a fantasy player playing in more games by avoiding injury is a good thing, and the majority of “top of the leaderboard” players in total points are still there no matter how you measure it. But missing a few games is very common, so I prefer looking at points per game (PPG).
For example, not including Week 18, Lions’ RB Jamaal Williams finished the season as the Points Per Reception (PPR) RB15 in total points scored, but finished as the RB21 in PPG (12.9 PPG). On the flip side, fellow Lions’ RB D’Andre Swift finished as the RB24 in total points scored, while finishing as the RB16 in PPG (13.5 PPG). So which is better? On average, Swift scored more fantasy points in the games he played than Willimas did in the games he played. But Williams was available as your fantasy starter the entire fantasy season. Swift was not. So again, which is better? In total points, it’s Williams. In PPG, it’s Swift. The question becomes about preference. Having a player who scores 13.5 PPG in 13 games or a player who scores 12.9 PPG in 16 games? As with any analysis, there is more to it than that. I prefer using PPG but I am the first to admit PPG is not perfectly representative either. Fantasy football is a weekly game, and one way to pull back the curtain on the season-long finishes we will inevitably use as part of our 2023 projection process in a few months is to look closer at PPG consistency across individual weeks during the season. That is what I will be doing in this article, starting with the RB position.
Note: For my discussions of the fantasy leaderboards, I do not include any Week 18 data (or Week 17 data before 2021). The majority of fantasy football leagues do not include the final week of the NFL regular season in their fantasy football season, so it should not be included in the analysis or statistics being used to discuss fantasy football. Due to this, the fantasy points PPG numbers in this article will look slightly different than what you will see on most websites that include all 18 weeks.
Quick Links
2022 Top 36 RBs: PPG Consistency
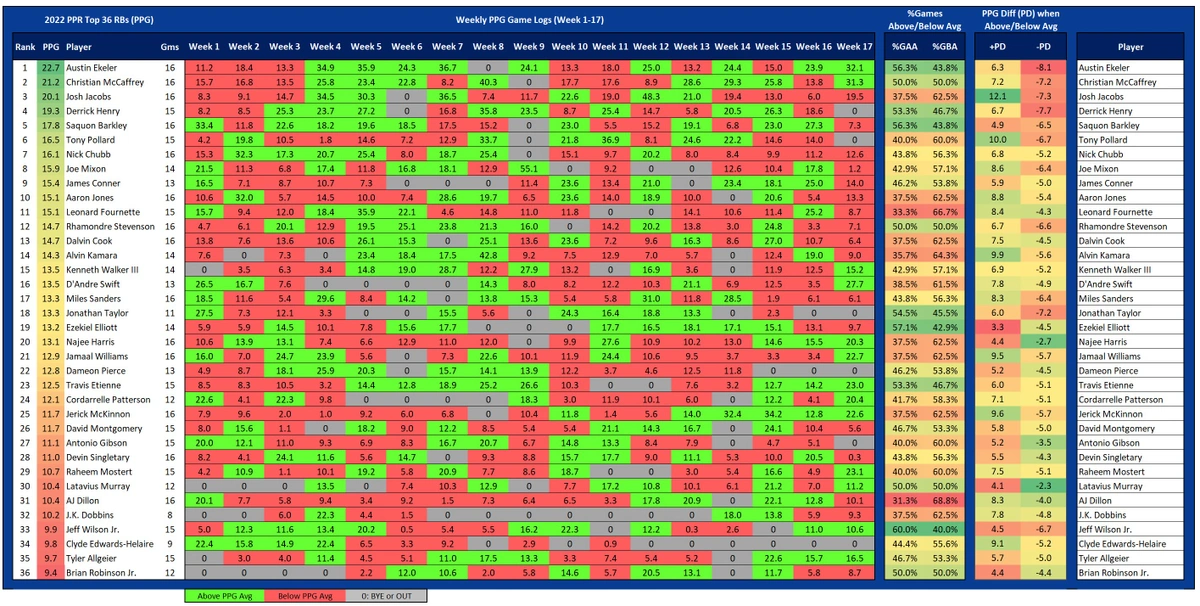
Starting with RBs, the following chart looks at PPG consistency. The 2022 Top 36 RBs are based on PPR, PPG, and a minimum of eight games played. The following comprises this data set:
- Top 36 PPR RBs
-Season-long PPG (Week 1-17) - PPR points scored game log (each RB’s points scored in each game played)
- Percentage of individual games (%Games) scoring above season-long PPG average (%GAA)
- Percentage of individual games (%Games) scoring below season-long PPG average (%GBA)
- Positive PPG Difference (+PD): Shows RB’s PPG average in games the RB scored more points than their season-long PPG average.
- Negative PPG Difference (-PD): Shows RB’s PPG average in games the RB scored fewer points than their season-long PPG average.
One way to measure consistency is %GAA. Not surprisingly, the overall RB1 (Austin Ekeler) was one of the more consistent RBs by this number. Ekeler scored more than 22.7 PPR points (season average) in nine of 16 games played (56.3%), depicted by the green-shaded point totals across his games played. But like any statistic, %GAA by itself doesn’t automatically equate to a high finish for an RB. Ekeler was one of 11 RBs in the Top 36 with a %GAA at or above 50%, a group that includes Jeff Wilson Jr. (RB33) and Brian Robinson Jr. (RB36).
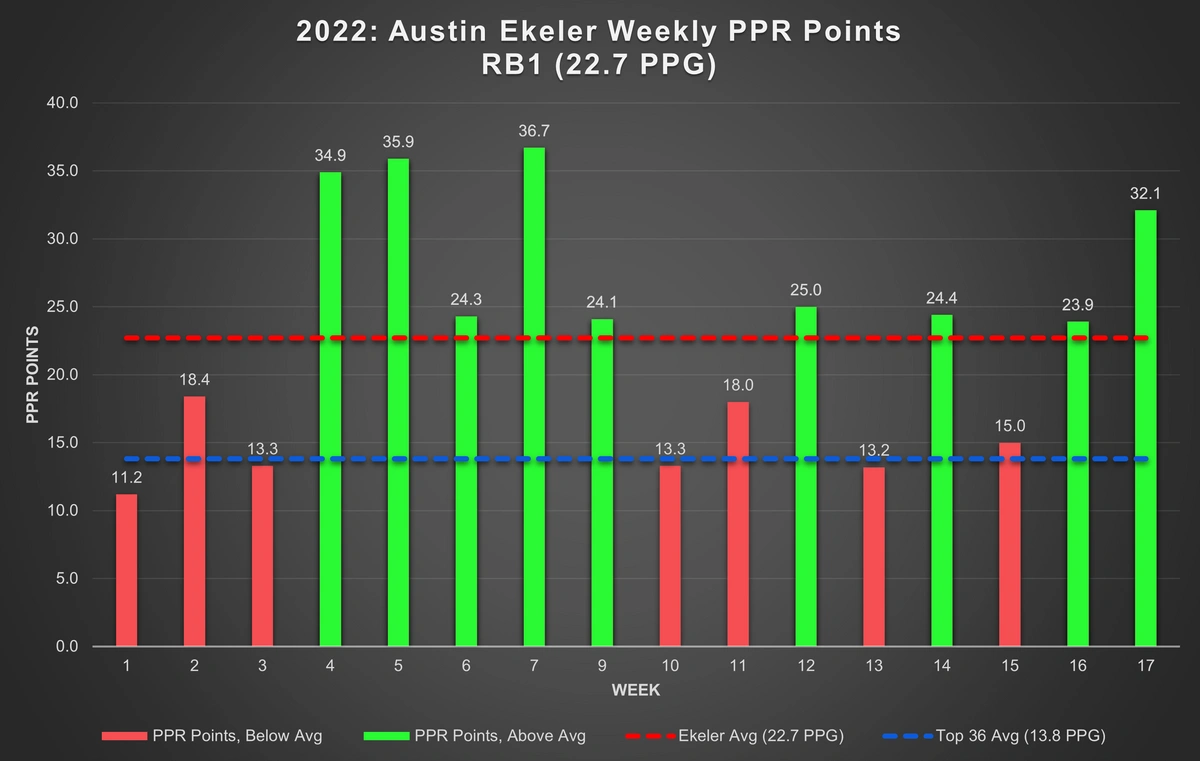
The table above includes the weekly game logs because I think it’s both interesting and helpful to see the individual pieces of a player’s season-long PPG. A graphical depiction adds another visual angle from which to view PPG consistency. Here is Austin Ekeler’s weekly scoring for the 2022 season. The graph includes points scored each week (color-coded for either above or below average), Ekeler’s season-long average, and the season-long average of the Top 36 RBs.
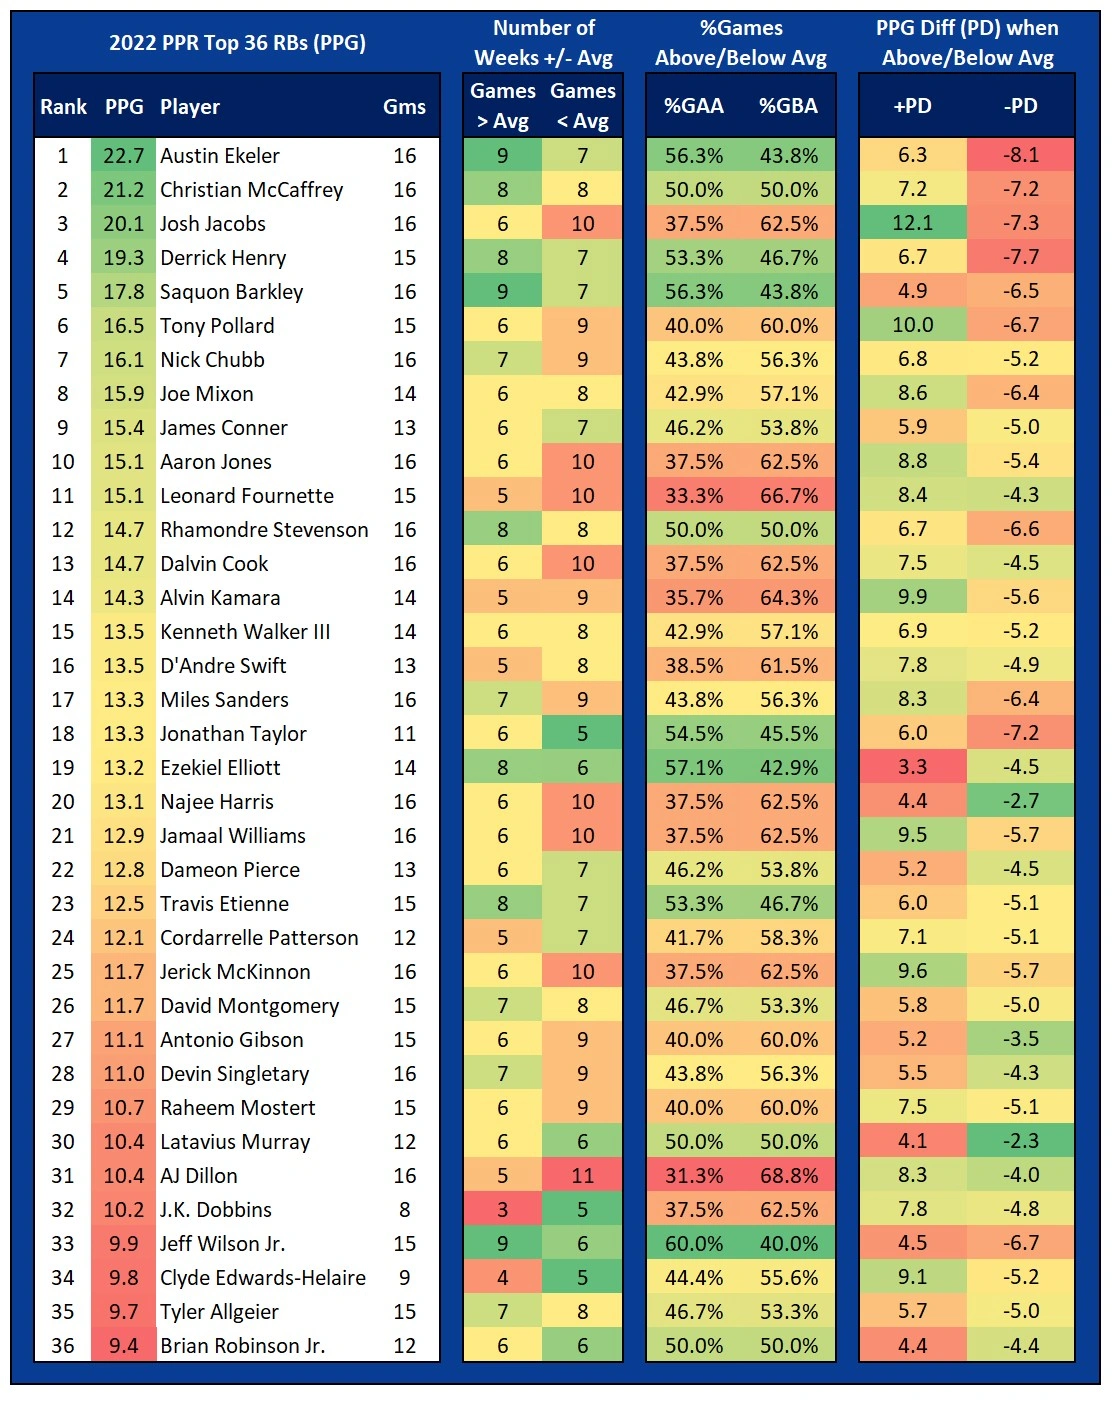
I admit a lot is going on in the game logs chart above. The following chart contains the same data, but with the Week 1-17 game logs removed. This way you can still reference any week or group of weeks for any RB in the first table, but use this consolidated version for the rest of this discussion.
Looking at consistency in this way is a method of deciphering the structure of a player’s fantasy season. Season-long PPG and associated RB rank do not tell the full story. But, inevitably, when a large portion of the Redraft community returns to the fold this summer, many will go straight to the 2022 season-long stats and stop there. I did this for years. And I’m not passing any kind of judgment here. That’s a big reason why I choose to spend the time digging into this stuff, so others don’t have to. We get caught up in the week-to-week during the season but it’s easy to forget the fluctuations we witnessed during the chaos of the season once the season is over, especially months later as the next season becomes imminent. That is why I like to do this analysis now. Some may look at the fluctuations in PPG scoring week-to-week, simply attribute it to variance, and move on. And that’s fine. I am choosing to dig deeper.
You’ll notice Ekeler’s +PD is middle of the pack at 6.3 (21st highest). What this means is in the nine games Ekeler scored above his 22.7 PPG average, his average was 29.0 PPG (6.3 points above 22.7). But this mid +PD is common among RBs with a %GAA at or above 50%. Which makes logical sense. The more games a player is above average, the fewer games they spend below average, meaning less heavy lifting for the above-average games to arrive at the season-long average. If you just look at that group of 11 RBs with a %GAA at or above 50% (Ekeler, Christian McCaffrey, Derrick Henry, Saquon Barkley, Rhamondre Stevenson, Jonathan Taylor, Ezekiel Elliott, Travis Etienne, Latavius Murray, Jeff Wilson Jr., and Brian Robinson Jr.), Ekeler had the third-highest +PD behind only McCaffrey and Henry. It is also inherently difficult for RBs with higher PPG averages to exceed those higher averages by significant amounts on a consistent enough basis to significantly increase their +PD. This is a common trend as consistency increases. Here is Derrick Henry’s %GAA and +PD from 2018-2022.
Henry’s consistency (measured by %GAA in this case) has steadily increased, from 33.3% in 2018 to 53.3% in 2022, the first year Henry exceeded 50%. In that same time frame, Henry’s +PD has steadily decreased, from 12.6 in 2018 to 6.7 in 2022. Henry has become more consistent and less reliant on spike weeks as he has settled in as a perennial Top 5 RB over the last three seasons. The fantasy community has been discussing the eventual falling off for Henry as he gets older and accumulates more seasons of ridiculous usage. But no one told Henry in 2022. Henry led the NFL with 349 carries (21.8 carries per game) for over 1,500 rushing yards and 13 TDs. He also set career highs in targets (41), receptions (33), and receiving yards (398). Henry will eventually hit the dreaded “RB cliff,” but he seems to be a bit of a unicorn, so perhaps that cliff is farther away than it would be for most NFL RBs.
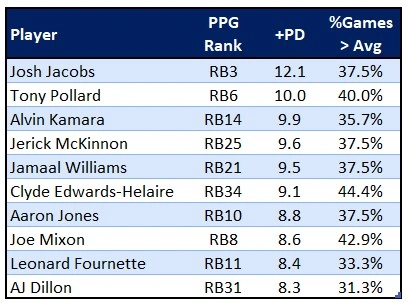
Moving in the other direction, higher +PD is attached to a lower %GAA. Here are the Top 10 RBs sorted by +PD and their %GAA:
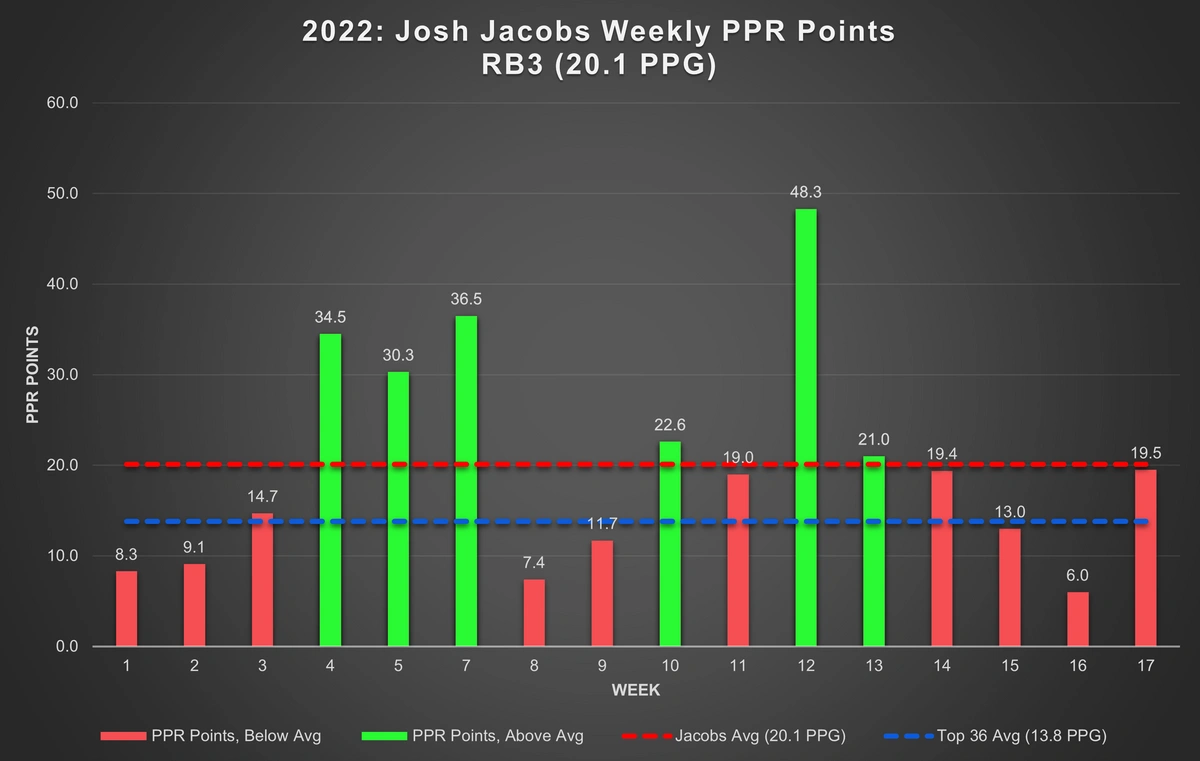
Seven of these 10 RBs were above their PPG in less than 40% of games played. And the majority of that was heavily influenced by spike weeks. Josh Jacobs had the highest +PD of any RB, averaging 32.2 fantasy points (+12.1) in his above-average games, which was the main contributor to Jacobs finishing as the RB3 even with a %GAA of only 37.5%. Jacobs scored 30+ fantasy points in four games, including 48.3 points in Week 12.
This is not an anti-Jacobs stance. Jacobs was my non-Travis Kelce fantasy MVP on the season. He was a massive value at his Redraft preseason Average Draft Position (ADP) of RB24 (according to Sleeper). Jacobs did score below average during the Week 14-17 crunch time, but in two of those games, he was less than a point off of his average. The point here is that Jacobs was a relatively inconsistent RB who finished in the Top 5. He relied on spike weeks and had the second-lowest -PD. Jacobs was below his PPG average in 62.5% of his games, and in those games, he was 8.6 points below his average (11.5 points). Jacobs showed he has a high ceiling but is it repeatable? And is the risk that it’s not worth the much higher draft cost Jacobs will fetch in 2023?
Joe Mixon (RB8) and Alvin Kamara (RB14) also relied on spike weeks, but for each, it was one massive game that skewed their +PD. Mixon (+PD of 8.6, eighth-highest) scored 55.1 points in Week 9.
Joe Mixon out here giving us the finger with his weekly PPR point totals. pic.twitter.com/vej4O2fytI
— Scott Rinear (@MunderDifflinFF) January 15, 2023
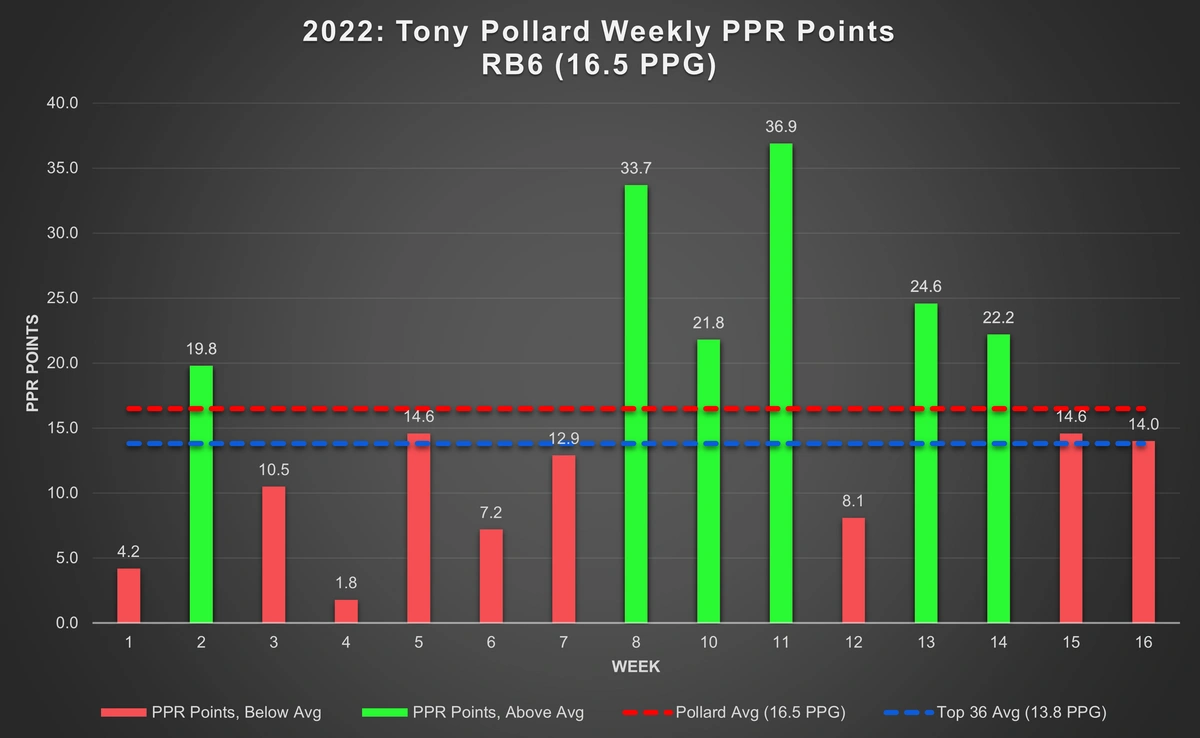
Kamara (9.9 +PD, third-highest) scored 42.8 points in Week 8. Tony Pollard (RB6) had the second-highest +PD of 10.0, but his above-average games were more consistent than Mixon or Kamara.
Ezekiel Elliott (RB19) is concerning when looking at this data. Zeke was consistent with a %GAA of 57.1% (second-highest) but with a +PD of only 3.3, Elliott’s ceiling of seasons past disappeared. Elliott had career lows across many statistics, including rush attempts, rushing yards, and yards per carry. Even more, concerning was Elliot’s receiving numbers compared to his career averages before 2022:
- Targets: 23 (Career average: 63.2)
- Receptions: 17 (Career average: 48.0)
- Receiving yards: 92 (Career average: 374)
- Receiving TDs: 0 (Career average: 2.0)
This was the result of two factors. A now 27-year-old Elliott simply not being as good as he once was and Tony Pollard ascending into the RB1 (Top 12) echelon, even while sharing the backfield with Elliott for a majority of the season.
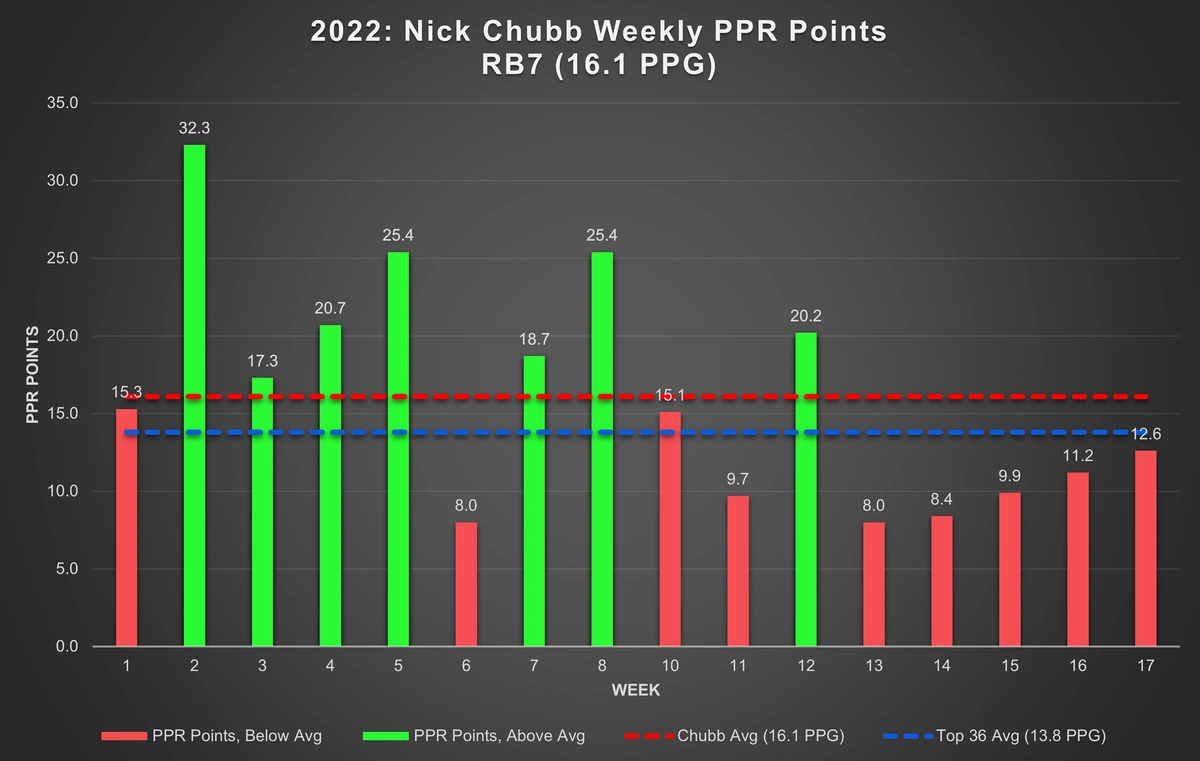
Another interesting trajectory occurred with Browns’ RB Nick Chubb. In PPR formats, Chubb has been the poster boy for the uber-talented RB for which the overall RB1 is out of reach, due to a lack of receiving work. I stand by the notion that if Chubb was given a Saquon-Barkley-like workload, he would threaten to be the RB1 every season. Through Week 8, it was looking like he might finally buck his own trend, as he sat at 20.4 PPG (RB3 at that time). Through Week 12, he slid back to RB5 at 18.9 PPG, but his consistency numbers were excellent. Through Week 12, Chubb’s %GAA was 63.6% (seven of 11 games). The only other RB who hit that mark through Week 12 was Rhomondre Stevenson. Chubb finished the season with a %GAA of 43.8%. Week 12 was the last game Chubb would score above his PPG average.
From Week 13 onward, Chubb averaged 10.0 PPG. There’s another thing that happened in Cleveland starting in Week 13. Deshaun Watson took over as the starting QB. Maybe he was rusty after such a long layoff, but this does not bode well for Chubb in 2023 unless Watson can return to at least an approximate version of his pre-2021 success.
What I’d give to see Nick Chubb on a different team. pic.twitter.com/KmysexLdIE
— Scott Rinear (@MunderDifflinFF) January 16, 2023
Alvin Kamara
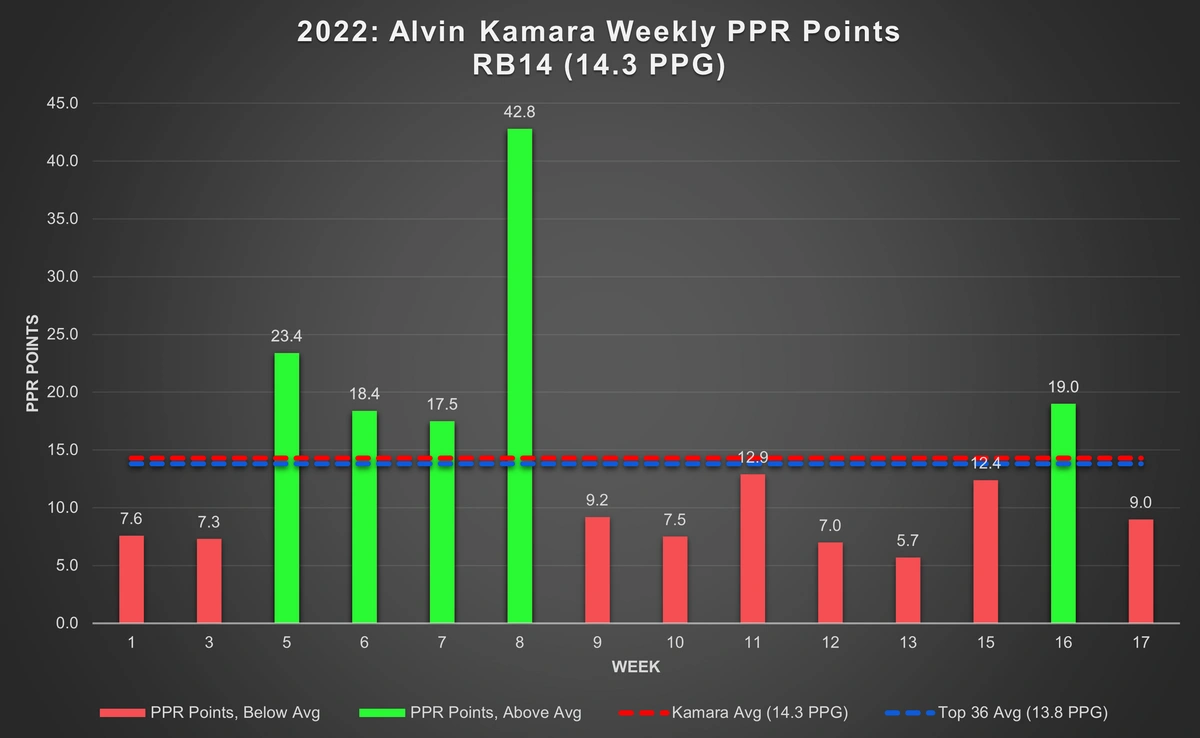
Before moving on to Weekly Ranks, I want to take the Kamara discussion a little further because I noticed something interesting and important in his historical trends. Here is the 2022 weekly PPG graph for Kamara:
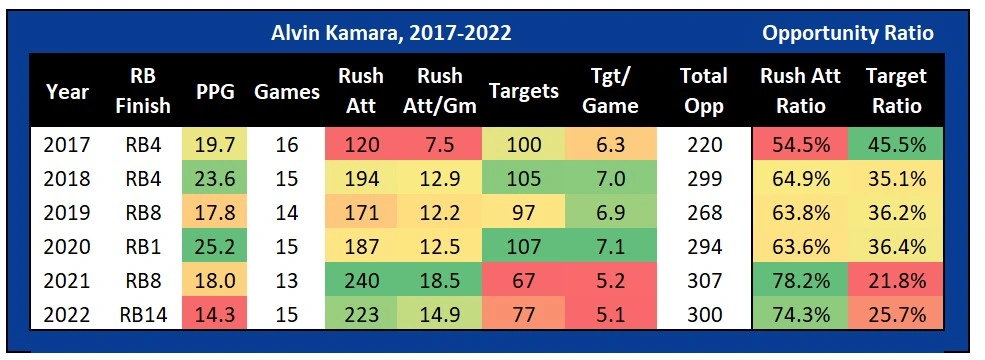
There is no sugarcoating it, Kamara had a very disappointing fantasy season finishing as the RB14. But I’m not ready to write Kamara off just yet. Anyone paying attention could see that Kamara was utilized nowhere close to the way he should have been for much of the season. Kamara has feasted during his career as a pass-catcher, and he saw his lowest targets per game (5.1) in 2022. Entering 2022, Kamara had averaged 6.5 targets per game in his career, and a 1.5 target per game decrease is significant. And that number is somewhat inflated by his string of high-target games Week 5-8. During that stretch, Kamara averaged 8.5 targets per game, and his fantasy PPG shot up to 25.5. Yes, the 42.8-point game is included there, but even if you remove the three TDs Kamara scored in that game, that four-game average is still up to 21.0 PPG. Close to seven PPG higher during a stretch of games where Kamara’s strength was effectively utilized, albeit with fantasy-friendly matchups versus the Seahawks, Cardinals, and Raiders in those weeks. In the nine games following Week 8, Kamara saw more than four targets in only two of them.
What is more concerning about this shift in usage for Kamara is that it is not isolated to 2022. Here are some of Kamara’s stats from 2017-2022. You can see the glaring trend over the last two seasons.
Note: The equation for Opportunity Ratio is as follows:
- (Rush Attempts)/(Rush Attempts + Targets) compared to (Targets)/(Rush Attempts + Targets)
Kamara’s sweet spot with Opportunity Ratio is right around 65% rush attempts and 35% targets. That was the approximate ratio from 2018-2020, when Kamara finished as the RB4, RB8, and RB1. You can see over the last two seasons, that ratio has swayed further in the rush attempt direction to approximately 75%-25%. Kamara is a very talented RB, and this is not a knock on his rushing ability. But he needs more than 5.1 targets per game to fully tap into his elite fantasy scoring skill set.
2022 Top 36 RBs: Weekly Rank Consistency
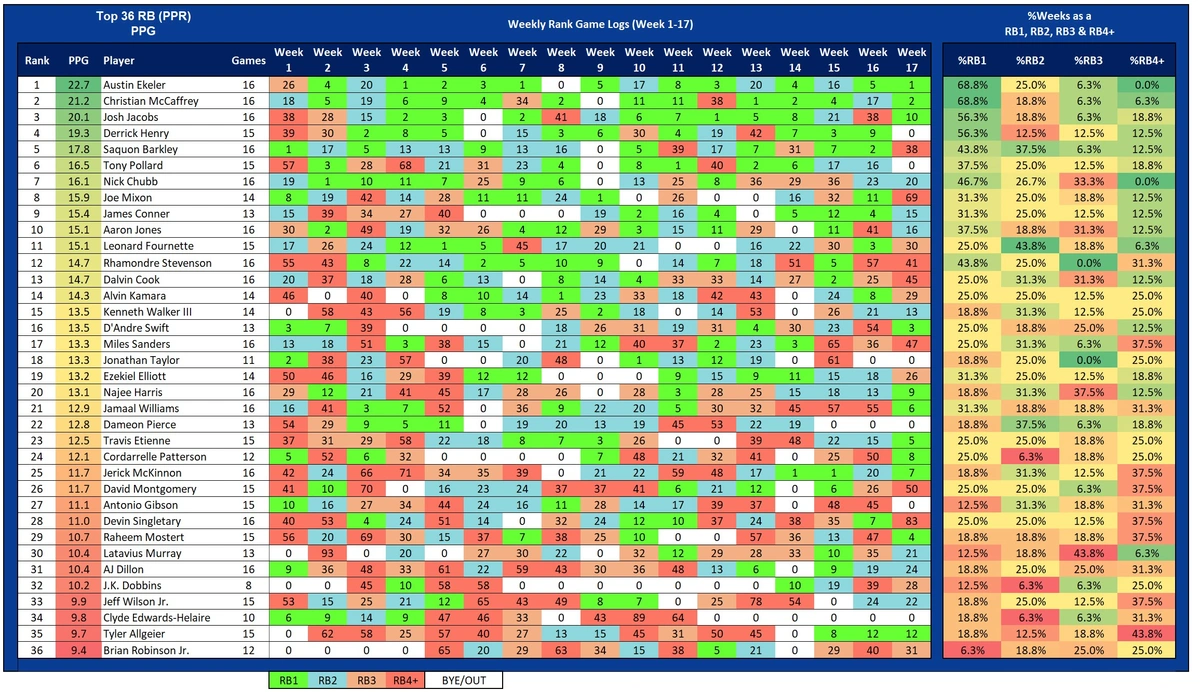
Weekly ranks fit right into this discussion as well. The following chart looks at weekly rank consistency. Looking at the same group (Top 36 RBs), the following comprises this data set:
- Top 36 PPR RBs
-Season-long PPG (Week 1-17) - Weekly rank game log (each RB’s PPR rank in each game played)
- Percentage of individual games (%Games) finishing as an RB1 (Top 12) (%RB1)
- %Games finishing as an RB2 (RB13-RB24) (%RB2)
- %Games finishing as an RB3 (RB25-RB36) (%RB3)
- %Games finishing as an RB4 or worse (RB37+) (%RB4+)
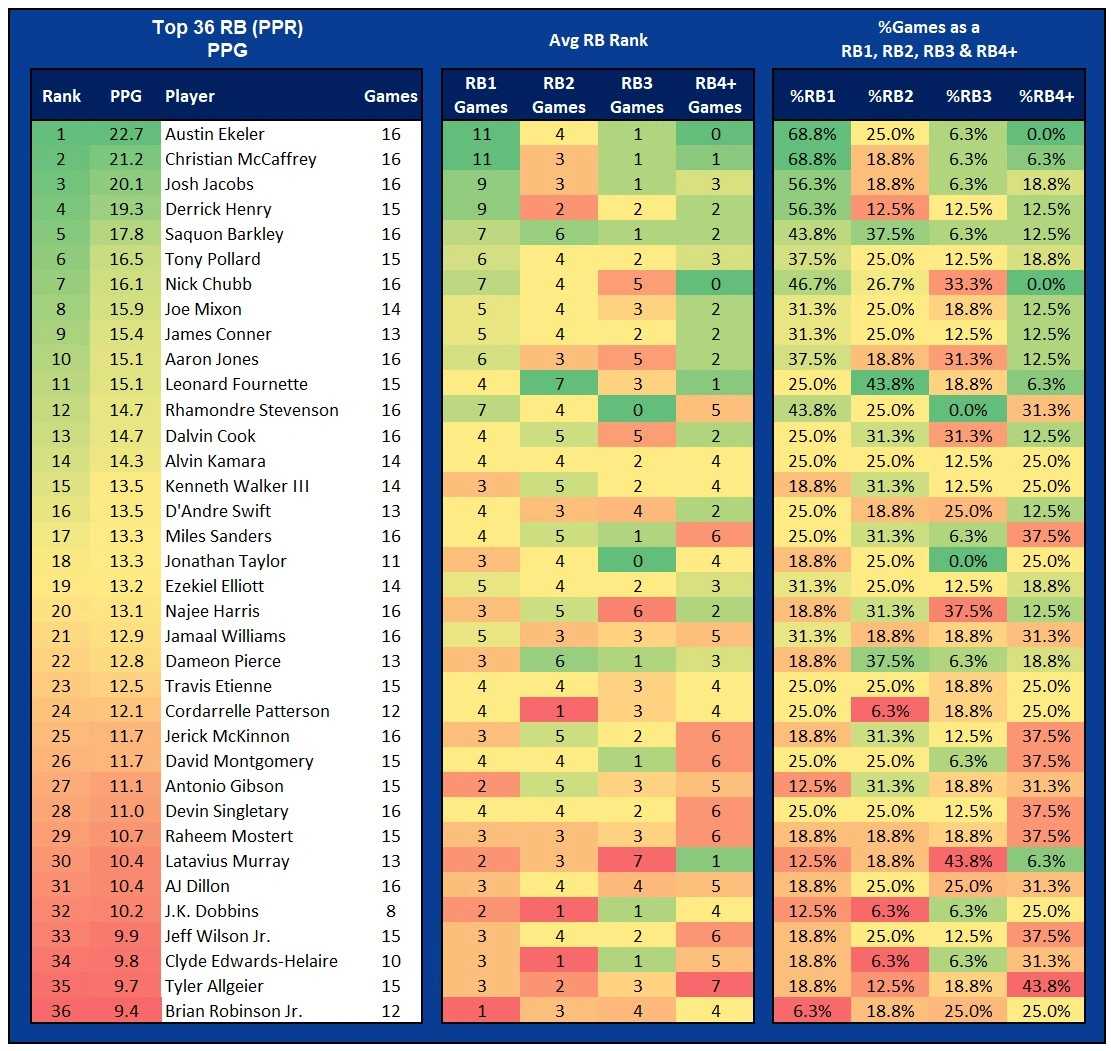
Weekly rank data adds another layer to the consistency topic. Ultimately, fantasy points are what rule the day, a rank does not. But I think it is an important piece to include with the PPG discussion because it helps tell the same story about the structure of an RB’s fantasy season. As with the PPG data, I will also include the consolidated chart with the game logs removed. But just like the PPG chart, it helps me to see the weekly ranks across individual games visually.
Starting with Ekeler again, he exhibited another measure of consistency by being one of only two RBs in the Top 36 to have zero weeks outside the Top 36 during the season. Ekeler was the RB1 so there are no big takeaways or secret formulas with him. He is a really good dual-threat RB with a nose for the endzone and a safe PPR floor, so it is not surprising he remained within the Top 36 all season. But doing that is rare, and doing that while also tying for the most RB1 games with 11 (%RB1 of 68.8%) is even more difficult. Nick Chubb was the only other RB to avoid an RB4+ outing, but he also has the highest %RB3 (33.3%) of the Top 10 RBs.
Rhamondre Stevenson was the only RB outside the Top 10 who had a %RB1 above 40%. His %RB2 was 25.0% and his %RB3 was 0.0%. Stevenson had a breakout season finishing as a low-end RB1. The knock on Stevenson from this view was that his weekly rankings also show that when he was off, he was way off. Stevenson was tied for the third-highest %RB4+ at 31.3%. Stevenson’s PPG graph is an appropriate piece to pull into this section, as it shows his consistency for most of the season. He was not far off from being above his PPG average for 10 consecutive games (Week 3 through 13). We just need him to avoid the low-floor games.
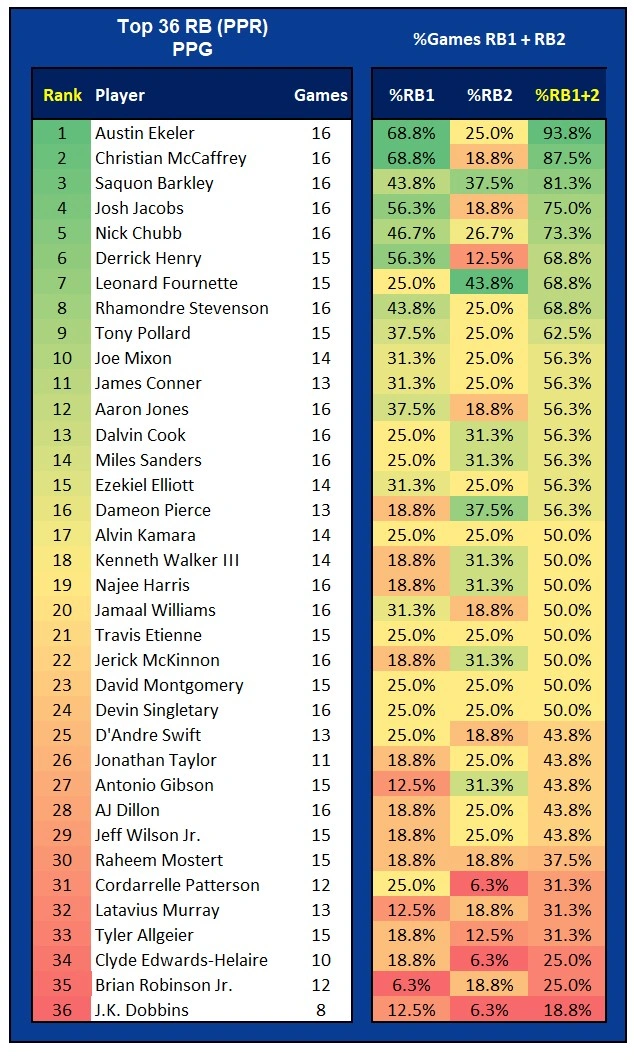
Stevenson is a good example to lead me to my favorite data set with weekly ranks, which is %RB1+2, or the percentage of games an RB was either an RB1 or an RB2 (or more simply put, the percentage of games in the Top 24).
For this chart, I sorted the ranks by %RB1+2 from highest to lowest. You can see Stevenson ranks eighth by this metric and Chubb jumps up to fifth. Other than that, there is not much difference between this Top 36 and the PPG Top 36, but it conveys the consistency I have been discussing.
In the next installment of this “2022 Season Recap” series, I will be going through the same data sets with the 2022 Top 36 WRs. Spoiler alert, DeVonta Smith had a relatively quiet but excellent season.
Thanks for reading! If you have any questions about the data used in this article or about fantasy football in general, feel free to hit me up on Twitter.

