
Another week of NFL football, another pile of data to sift through looking for clues. Clues as to what leads to certain results and clues for speculating what might be coming next. They say, “Looks can be deceiving.” The same can be said for surface-level statistics in fantasy football. In this weekly article series, I will be looking beneath the statistical surface, beyond the standard box score, using the premium statistics provided by FantasyData, including advanced and efficiency metrics across the fantasy skill positions, to search for puzzle pieces that fit together.
Hold the Line
Week 6 of the 2022 NFL Season is upon us. As we rapidly approach the season’s halfway point, some of the tumultuous early season results have been stabilizing. The first few weeks of a fantasy season will always see surprising names jumping to the top of leaderboards, while some “studs” leave us questioning our draft choices. It is inevitable because of the way fantasy success is measured. Touchdowns and big games from “out of nowhere” players can skew the perception of what is likely to happen as the sample size grows. As the offseason comes to an end and we tell ourselves to not overreact to the first few games, it becomes easier said than done once the action starts. After months of speculating and forming visions of how things will play out, it is difficult to remain patient and hold the line once we go from zero NLF games in six months to 16 NFL games in four days.
RB Opportunity Share (OS)
But now we are in Week 6. Certain players we spent high draft capital on, who got off to slow starts, are now finding their groove. In this article, I will be discussing RBs, by first looking at one of the most important metrics for RBs: Opportunity Share (OS). This metric looks at an RB’s opportunities, comprised of the sum of their rush attempts and receiving targets, and what share that represents of that team’s market of opportunities. Hence, Market Share.
Part of the purpose of this article is to point out the different types of Opportunity Shares that we use. This was a point of confusion for me when I first got started in this space, as my understanding at that time was that there was one Opportunity Share for RBs. I want to explain the differences here in case you are in those same shoes I was in. I was under the impression that there was one Opportunity Share metric: RB rush attempts plus targets divided by total RB rush attempts plus RB targets. An individual RB’s opportunities compared to all RB opportunities for that team. And this is a highly useful metric. I am not trying to downplay that fact. But this only looks at RB involvement/usage compared to the other RBs on his team. It factors in target share, but only compared to other RBs, and typically only one RB is receiving a notable amount of targets for a team. It does not tell us as much about RB’s involvement in the team’s overall passing attack, which is an important piece in today’s NFL. Also, with the rise of the running QB in the NFL, an RB’s rush attempts compared only to other RBs do not tell us as much as they once did. That is where the second more team-oriented OS enters the discussion.
There are two types of OS for RBs I’ll be focusing on, and they are distinguished by how we define the “market” they are sharing from:
- RB Opportunity Share (RBOS)
- Team Opportunity Share (TOS)
RBOS measures an RB’s opportunities (Rush attempts plus targets) and what proportion (share) of the team’s total RB opportunities (market) that represents.
TOS Measures an RB’s opportunities and what proportion of the team’s total opportunities (for any position) that represents. This measures RB targets against total team targets, which is a more accurate representation of target share as a piece of the TOS equation. It also measures RB rush attempts against total team rush attempts. An RB could be dominating the rush attempts compared to the other RBs on his team, but a QB running it 10 times per game impacts his opportunities. That impact is not captured by RBOS. It is captured by TOS.
However, both versions of OS for RBs are relatively predictive metrics when it comes to fantasy output.
RBOS:
Typically, an RBOS above 75% is where you’ll find the “bell cows,” a category of RB workload dominance that is slowly evaporating.
The following shows RBs who have finished with a 75%+ RBOS since 2012.
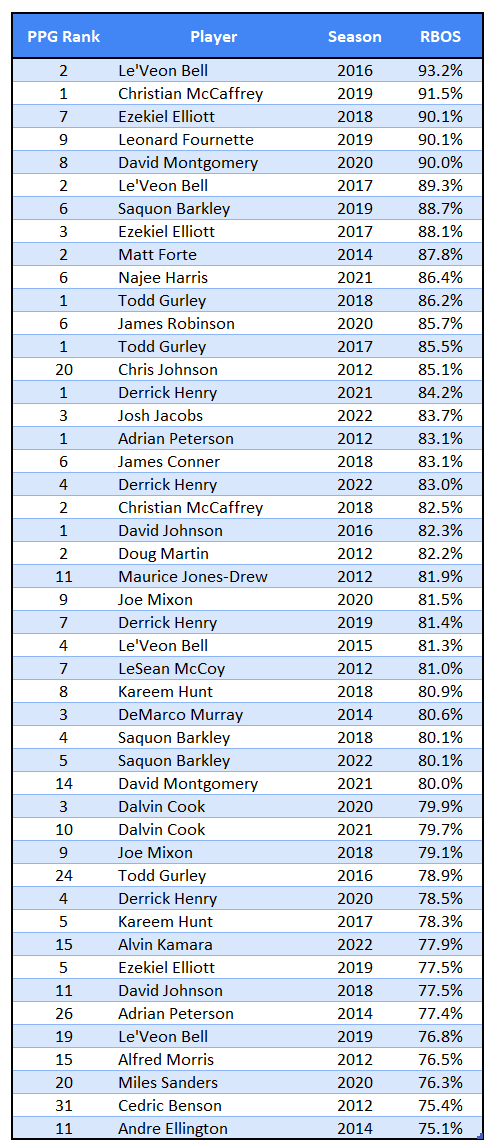
There have been 47 instances of an RB hitting a season-long RBOS above 75% since 2012 (minimum of eight games played). Thirty-eight of 47 (80.9%) finished as a Top 12 RB in PPR points per game (PPG). Now, 75% is an excellent number to attain, and it makes sense that it has correlated to higher fantasy points output. Currently, there are nine RBs above the 75% mark.
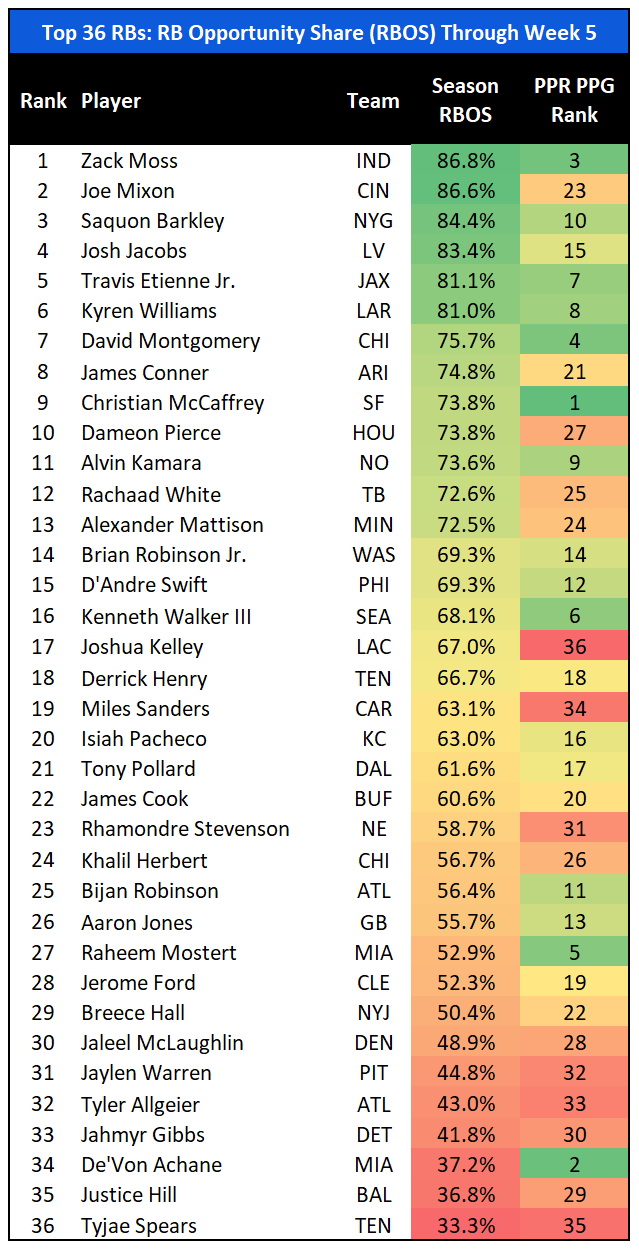
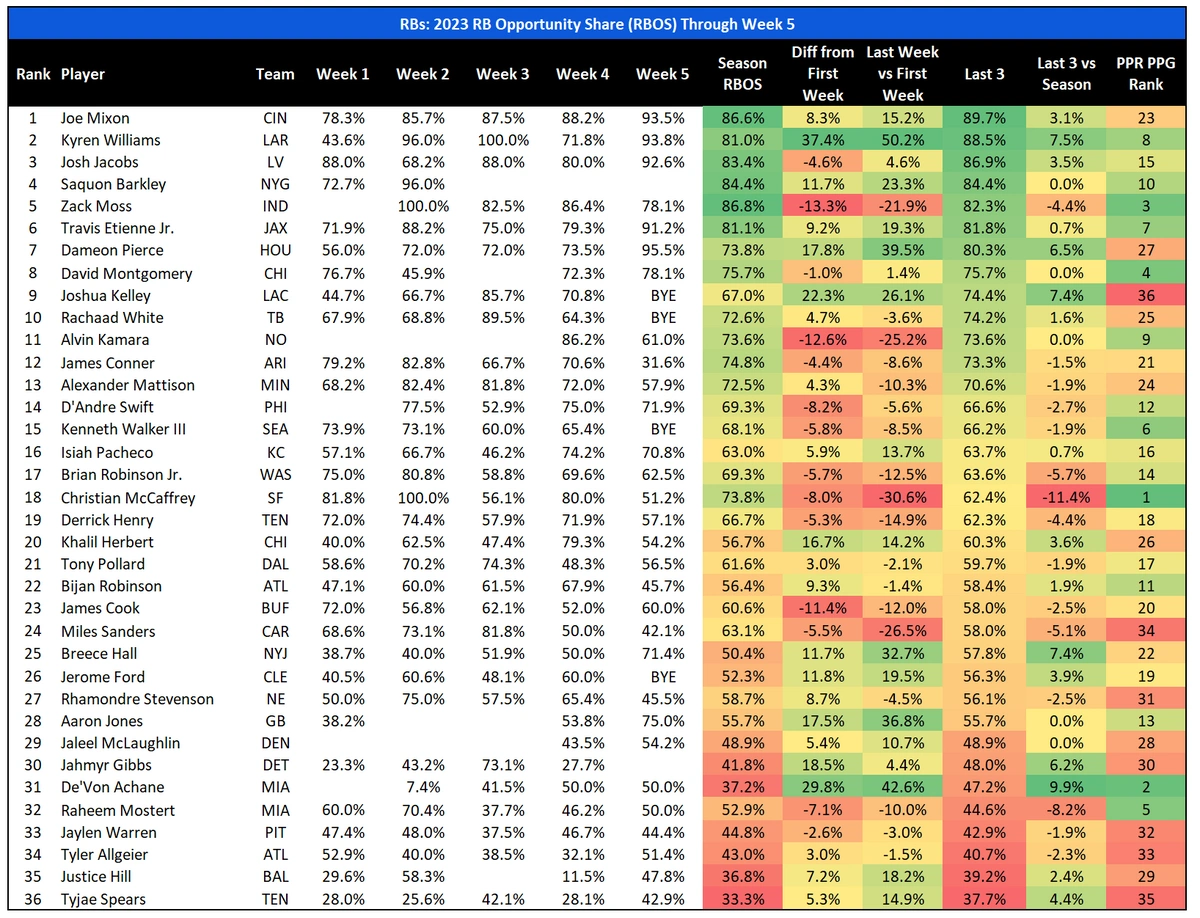
So far in 2023, there are six RBs currently above a 75% RBOS. Four of those RBs are in the Top 12 (66.7%) in PPG, which is under the historical average but by an amount that is not surprising through only five weeks. Here are the current Top 36 RBs in PPR PPG, sorted by RBOS from highest to lowest.
The two most surprising names in this group are Zack Moss and Kyren Williams, two RBs who were barely on the radar in redraft leagues at the start of the season. Both RBs’ recent domination of their respective backfields is somewhat out of left field. Williams battled injury during his rookie season after an atrocious performance at the 2022 NFL Combine and everyone (except me) seemed to be on the Cam Akers train. Let me be clear. I in no way predicted Kyren Williams becoming a thing. I was just lower than consensus on Cam Akers. Zack Moss has been an afterthought for years after toiling in mediocrity in the Bills’ backfield before moving on to the Colts. The difference between these two is staying power. Moss has likely earned a continued role, but that role will be reduced with the return of Jonathan Taylor. Williams currently has little competition for RB opportunities after Cam Akers was traded to the Vikings.
TOS:
A TOS threshold that correlates with fantasy output is 35%. An RB who sees at least 35% of their team’s opportunities (rush attempts plus targets for QBs, RBs, WRs, and TEs).
The following shows RBs who have finished with a 35%+ TOS since 2012.
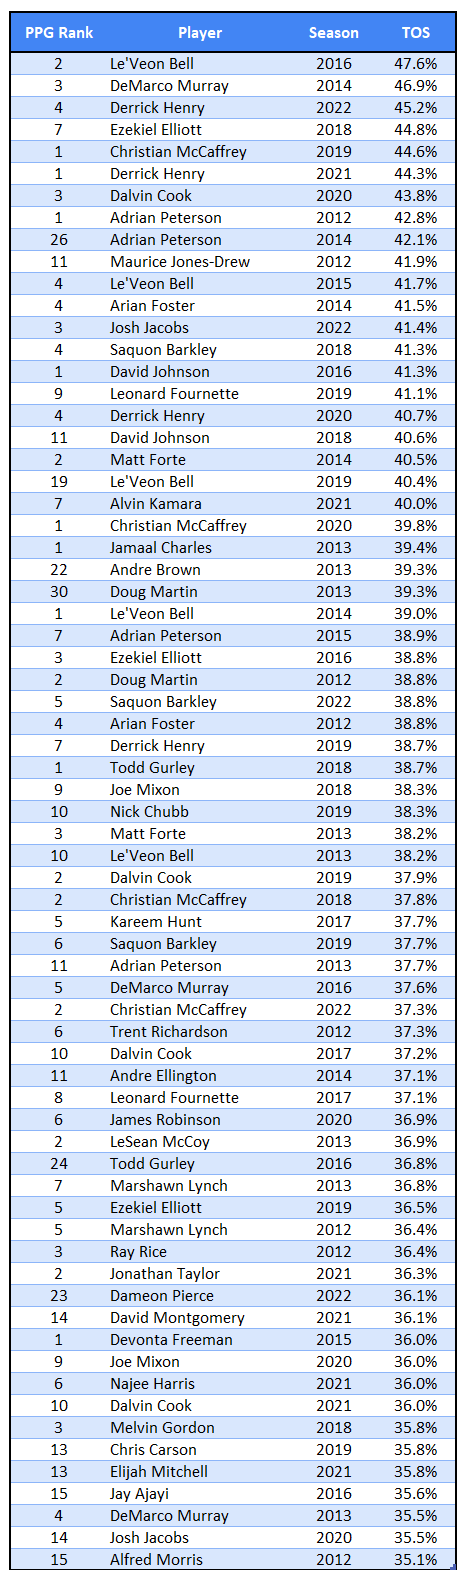
There have been 69 occurrences of an RB hitting a season-long TOS above 35% in that time frame. Fifty-seven of those 69 RBs (82.6%) finished as a Top 12 RB in PPR points per game (PPG). You can see that by using OS instead of RBOS, the pool of historical RBs is larger, and it includes more of the Top 12 RBs from those seasons, as the RB1 hit rate also increased by 1.5%. Both RBOS and OS are predictive, but OS has a slight edge in my view in its correlation to the scoring of fantasy points.
So far in 2023, there are 12 RBs currently above a 35% TOS (same larger player pool with this metric). Coincidentally, eight of those RBs are in the Top 12 (66.7%) in PPG, the same hit rate as RBOS. But again, this metric is capturing more total Top 12 RBs. Here are the current Top 36 RBs in PPR PPG, sorted by TOS from highest to lowest.
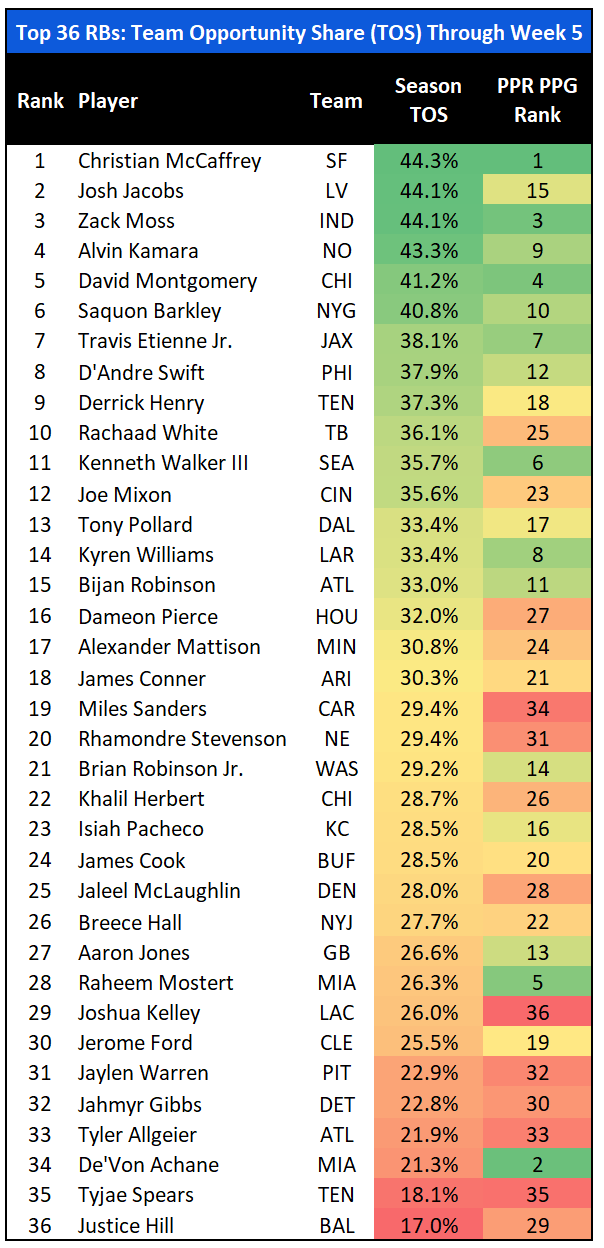
Two heavy hitters, Christian McCaffrey and David Montgomery, who did not make the 75%+ RBOS cut, both have a TOS above 40%. The significance of a 40% TOS cannot be understated. In the same player pool since 2012, 90.5% of RBs with a 40%+ TOS finished as an RB1.
Season-long market share stats and fantasy PPG overall rank can only tell us so much. Yes, most of the players at the top of this list are also at the top of the fantasy PPG list as well. But we can’t all have a team full of season-long 75%+ RBOS or 35%+ OS RBs. There are multiple names currently lower in the Top 36 RBs who merit recognition based on which direction they are trending.
RBOS Trends
The following chart includes the Top 36 RBs (PPR, PPG) and shows:
- Weekly RBOS for each RB
- Season-long RBOS
- Difference between Week 1 RBOS (or first game played) and overall RBOS.
- Difference between Week 1 RBOS (or first game played) and Week 5 RBOS (or most recent game played)
- RBOS over the last three games (Last 3)
- Difference between the Last 3 and overall RBOS
Positive Trends
This chart is sorted by RBOS over each RB’s Last 3. Five of eight RBs above 75% over their last three are Top 12 fantasy RBs (62.5%).
NOTE: This early in the season, one low RBOS due to an in-game injury significantly skews the trend for that player. So, in the trend calculations, I did not include those games (e.g., Week 5 for James Conner and Week 2 for David Montgomery). I also threw out D’Andre Swift’s bizarre Week 1 as it is not representative of Swift’s trend in usage.
Among the three categories of positive differences shown in this data (difference between season average and first game played, the difference between most recent game and first game played, and the difference between last three games and season average), the following players have shown a positive trend in RBOS across all three: Breece Hall, Dameon Pierce, De’Von Achane, Isiah Pacheco, Jahmyr Gibbs, Jerome Ford, Joe Mixon, Joshua Kelley, Justice Hill, Khalil Herbert, Kyren Williams, Travis Etienne Jr., and Tyjae Spears.
I will not be discussing all of these players, and some making this positive trend list is misleading. Gibbs shows an increase in RBOS across all three categories, but this is due to his 73.1% RBOS game (when Montgomery was injured) wedged right in the middle. Gibbs saw only a 27.7% RBOS in his last game played (Week 4). I still have faith in Gibbs as a fantasy asset this season, but his opportunity in that backfield has not started to legitimately trend positively yet. Joshua Kelley just kept Austin Ekeler’s seat warm as he dominated that backfield but did nothing with it fantasy-wise. Breece Hall is getting healthier, and his increase is the most promising (and exciting) one among these players. Tyjae Spears has been gradually trending upward and should be rostered in all leagues. Travis Etienne Jr. has officially arrived as a true RB1 stud, seeing his highest RBOP (91.2%) in Week 5. The concerning player on this list is Dameon Pierce. Other than Joshua Kelley (who cost you nothing on draft day), Pierce has the highest RBOP trends with the lowest RB rank (currently RB27). Pierce is the rare case of a player above an 80% RBOP while being outside the Top 24 RBs. I faded Pierce this offseason because his massive workload last year was barely enough to creep into the Top 24. My fade was based on that workload decreasing. This is worse, as his RBOP is increasing, the Texans’ offense is much improved, and he is playing worse.
Negative Trends
Among the three categories of negative differences shown in this data, the following players have shown a negative trend in RBOS across all three: Zack Moss, James Cook, D’Andre Swift, Christian McCaffrey, Raheem Mostert, Kenneth Walker III, Brian Robinson Jr., Miles Sanders, James Conner, Jaylen Warren, Alexander Mattison, Tony Pollard, and Tyler Allgeier.
Again, and even more so with negative trends, many of these are not concerning. McCaffrey had a week with the ever-elusive 100% RBOS in Week 2 and has bounced around between 50% and 80% in his other games. This will continue to fluctuate with McCaffrey but I shouldn’t have to tell you there is no concern. The same for Zack Moss, who also put up a 100% RBOS this season and has been hovering around 80% since. But his trend will likely trend downward with the return of Jonathan Taylor. Mostert’s RBOS was trending downward but will shoot back up following the injury to Achane. The players of concern here, whose usage and fantasy outlook are trending in the wrong direction include Cook, Robinson Jr., Sanders, Mattison, and Allgeier.
TOS Trends
The following chart includes the Top 36 RBs (PPR, PPG) and shows:
- Weekly TOS for each RB
- Season-long TOS
- Difference between Week 1 TOS (or first game played) and overall TOS.
- Difference between Week 1 TOS (or first game played) and Week 5 TOS (or most recent game played)
- TOS over the last three games (Last 3)
- Difference between the Last 3 and overall TOS
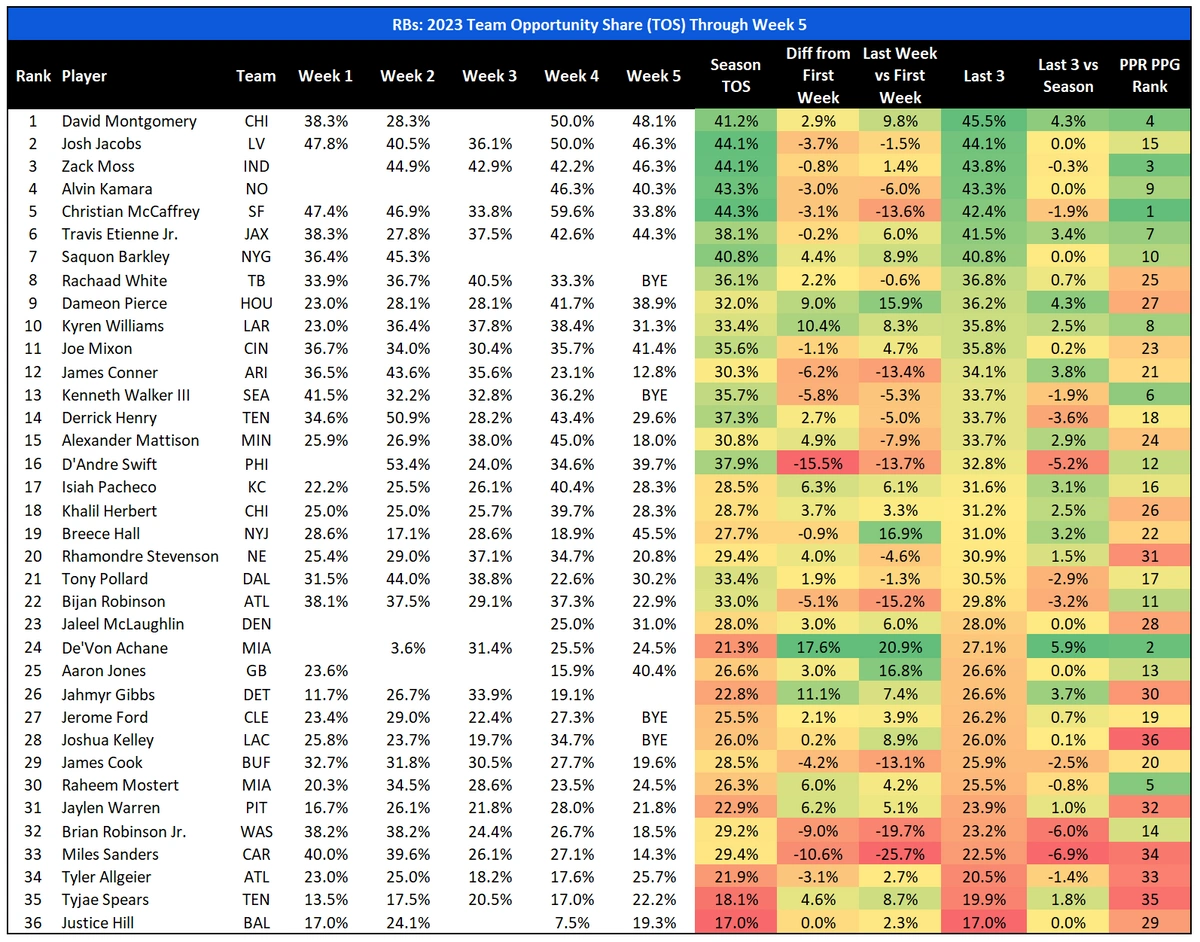
This chart is sorted by TOS over each RB’s Last 3. Seven of 1 RBs above 35% over their last three are Top 12 fantasy RBs (63.6%). The same trend appears here. Roughly the same percentage of 35%+ TOS RBs are Top 12 RBs, but TOS captures seven of them as opposed to the four shown with RBOS.
At this point in the season, there are not any significant differences in positive and negative trends whether you are looking at RBOS or TOS, but I wanted to include the same data for TOS as I will be revisiting RB Opportunity Share later in the season.
Thanks for reading! If you have any questions about the data used in this article or about fantasy football in general, feel free to hit me up on Twitter.