
Welcome back to another season of “Beneath the Surface,” a series I’ve loved writing for FantasyData where I look past the box scores. Another season of NFL football is well underway, creating a pile of data to sift through looking for clues. Clues as to what leads to certain results and clues for speculating what might be coming next. They say, “Looks can be deceiving.” The same can be said for surface-level statistics in fantasy football. In this weekly article series, I will be looking beneath the statistical surface, beyond the standard box score, using the premium statistics provided by FantasyData, including advanced and efficiency metrics across the fantasy skill positions, to search for puzzle pieces that fit together.
Popular Research Pages
- Advanced Player Metrics
- Efficiency Player Metrics
- Fantasy Player Projections
- Snap Counts
- Target Tracker
- Red Zone Data & Stats
- Third Down Stats
Market Share Trends
Heading into Week 5 of the NFL season we now have data sets that become a little more indicative of what’s happening and where things may be headed, from the overall team level down to the individual player level. One month of game data is still a relatively limited sample size, but certain trends begin to take shape beyond simply looking at who is scoring the most fantasy points. Market share trends that are unfolding before our eyes are one of my go-to places to start trying to decipher the story a given NFL season is telling. Statistics like snap share, target share, running back rush share, opportunity share, and air yards share, to name a few, all involve the foundation of any potential fantasy production: Opportunity.
Simply put, the fantasy skill position players on our rosters, to score the fantasy points via receptions, rushing/receiving yards, passing yards, and touchdowns, must both earn and be given the opportunity to do so. A high target share for a WR, for instance, is well-known as a good thing; it is better than a low target share. But it is important to put multiple pieces of this together at the same time when the data is happening essentially in real-time. The laws of averages and regression, over time or a large enough sample size always win out, and these concepts are also an important part of this puzzle. But each NFL season evolves and meanders differently, and fantasy football is largely a weekly endeavor. Yes, in dynasty formats there is an entirely different long-term angle from which managers must also view their players, teams, and leagues. But in redraft formats, and especially in Daily Fantasy Sports (DFS) formats, it is the same goal. Win the current week.
This is where it becomes important to not only look at the total market share numbers but also look for useful trends within those numbers. I am a big fan of looking at “per game” numbers, but even that is aided by the context of trends. For this article, I will start at the ground zero for all opportunities in fantasy football. A very important statistic that by itself, paradoxically, has the least direct correlation to actual fantasy points, and that is snap share. The journey to fantasy production starts by simply being on the field while the football is happening.
WR Snap Share
Starting with WRs, here are the Top 30 snap share rates so far (not including Week 5 Thursday Night Football). Also included are each WR PPR PPG and where they currently rank among WRs:
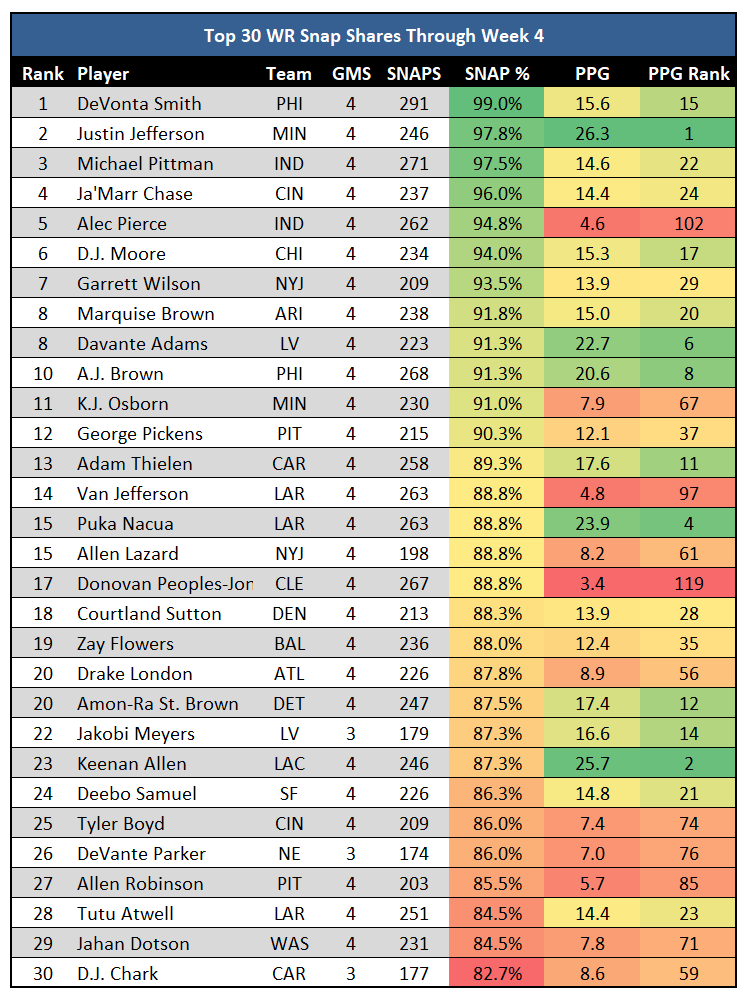
There are not a lot of surprises on this Top 30 leaderboard for WR snap share, especially with the players in the Top 10. However, there are some interesting names and situations that have materialized during the first quarter of the 2023 season. Puku Nakua leads all rookie WRs with an 88.8% snap share, only 0.8% ahead of the next-highest rookie WR, Zay Flowers. A lot of the time with rookies this early in the season, we are looking for promising trends that point toward potential fantasy success later in the season. That is not the case with Nakua and Flowers, as they have both already arrived. We will see what happens with Nakua’s playing time when Cooper Kupp returns, but he should stay on the field. DeVonta Smith continues to prove everyone wrong who thought he was too skinny for the NFL. Smith has yet to miss a game in his career and leads all WRs in snaps and snap share.
I want to point out a few players on this list that showcase the relatively weak correlation between snap share and fantasy points. You can see the green shading (higher PPG and rank) dispersed sporadically down the snap share leaderboard. And you probably also notice the absence of some of the top-scoring WRs. It is in the 60%-80% snap share range that you will find Tyreek Hill, Brandon Aiyuk, D.K. Metcalf, Terry McLaurin, Stefon Diggs, Chris Olave, CeeDee Lamb, and Nico Collins. As you will see later in the article, it is a much different case with RBs, where snap share correlates much stronger with fantasy points scored. The specific players I want to highlight are Alec Pierce, K.J. Osborn, Van Jefferson, Allen Lazard, and Donovan Peoples-Jones. These are WRs who see approximately 90% of their team’s snaps but are well outside the Top 50 WRs in fantasy points. I could just stop there. No, none of these WRs are high up on the fantasy-relevance list, but these are WRs who are rostered in deeper leagues, and they are WRs who have had some sleeper hype where managers might still be holding onto hope. I will expand the WR metrics to show you two things: Why you should probably give up hope and what it looks like visually when a metric that does have a strong correlation to fantasy points appears.
I will continue with this same player pool, the current Top 30 WRs in snap share, first adding routes data to the table, including total routes run and routes per game:
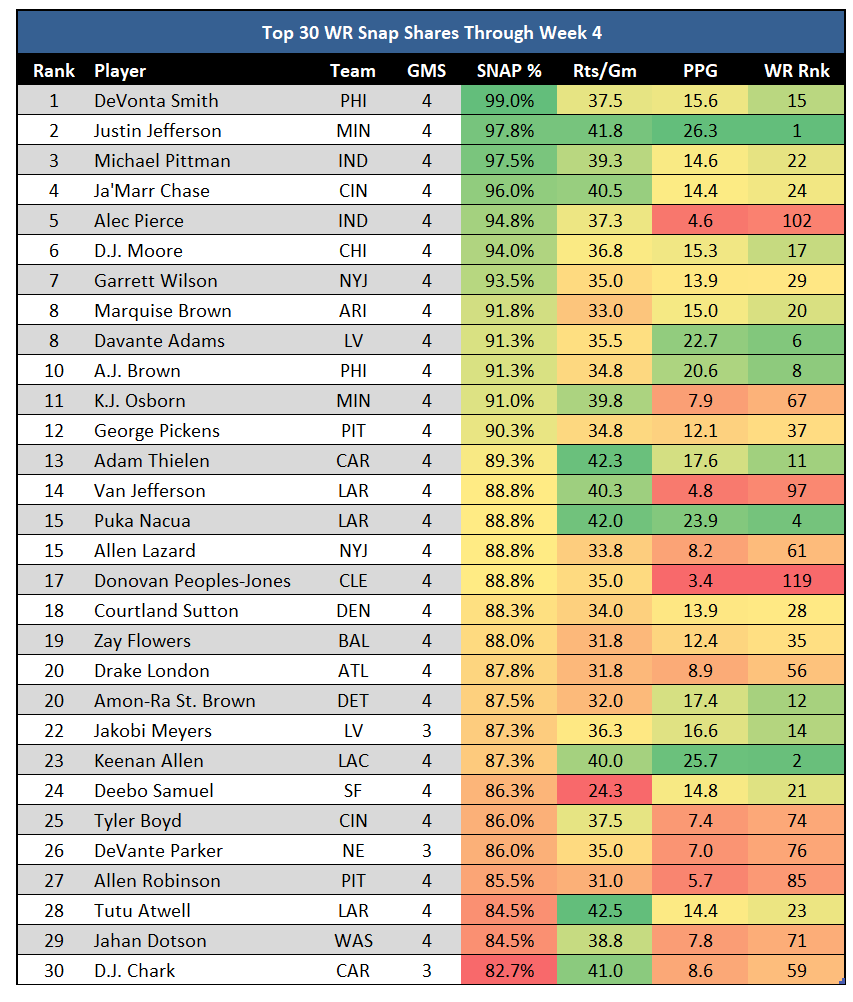
This adds a layer of data but you still have a mix of colors across many WRs stats. Spoiler alert. Visually speaking, a stronger correlation is indicated when the colors across most individual WR’s stats are the same or close to the same. Yes, Justin Jefferson is green across all three (snap share, routes per game, and PPG). But he is Justin Jefferson, and we cannot use the king’s stats to predict the stats of the peasants. But we still have some higher routes per game WRs with low fantasy points. And it is the same WRs I listed above. I promise I am working toward a point, not just needlessly shoveling more dirt on WRs who have not panned out. The path for a WR includes three key ingredients before they ever touch the ball. Two of them are being on the field (snap share) and running routes (routes per game). Route percentage, or the percentage of team pass plays in which a WR runs a route, is important as well. I did not include it here because all 30 of these WRs are above 90% route participation, with over half of them at 100%. These are WRs who are getting on the field (hence being in the Top 30 for snap share), being asked to run routes on most of the plays where routes are run and are running a quantifiable number of routes per game.
Now for the third ingredient before even a tenth of a fantasy point can be scored: Targets. On the field. Running routes. And earning targets. Once the ball is in the air and the target is earned, analytically, we mostly move away from the market share realm and into the volume, production, and efficiency realms. There are still market shares for receiving yards and TDs, but the target is the separation between two groups of WR skill sets. Target share is a strong metric to use to represent the target portion of this journey, but I will be using targets per route run (TPRR), as it fits better within our snaps, routes, and targets angle. Here are the same Top 30 WRs in snap share, with TPRR added in:
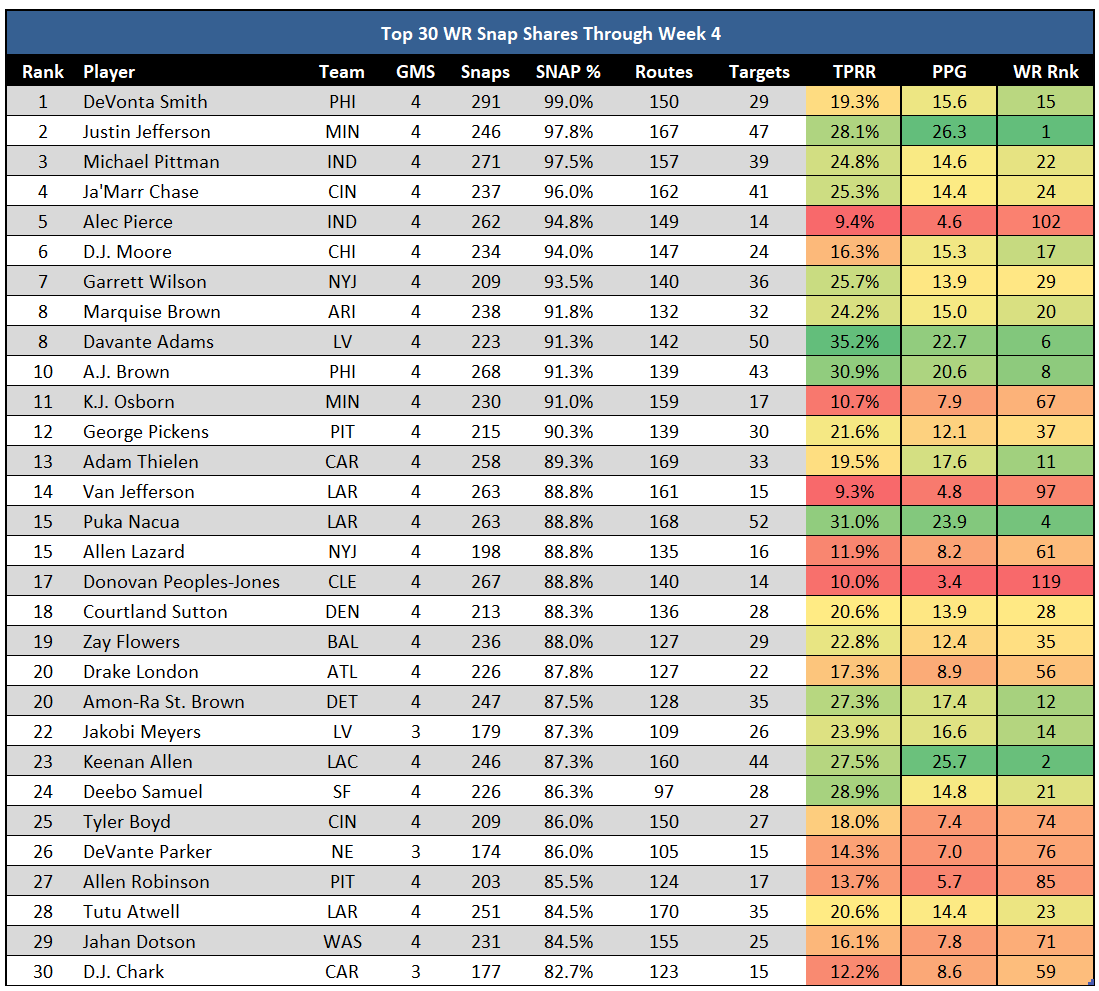
And there is your visual correlation. It looks similar to trying to match strands of DNA. No, it is not perfect. When someone finds a stat with 100% correlation to scoring fantasy points (other than fantasy points) they will become very rich, and then we will all wake up because that isn’t possible. But this is where the WRs I have henceforth deemed as hopeless show up. It is now red across the board for Pierce, Osborn, Van Jefferson, Lazard, and Peoples-Jones. Middle-of-the-pack fantasy scorers have middle-of-the-pack TPPRs, and the studs are all green. And sure, maybe we didn’t need all these words and statistics to conclude that you need to be targeted to score fantasy points. But that is not the only conclusion. Earning targets is much more difficult to significantly change. Snap shares fluctuate for different reasons but we have already seen the skill set needed to get on the field does not translate to the skill set needed to score fantasy points. Routes per game are even less indicative because that is largely influenced by the team’s offensive style and play-calling. Route participation is better because it is more of market share statistic that is not influenced by total numbers. But in the end, the WRs who are on the field a lot and running routes on most of their team’s pass plays, but have a TPRR in the red are not likely to ever be more than that. As I said, TPRR is not something that fluctuates wildly from year to year. These are WRs who, if you ever start them, will need to score a TD for you to be happy with the decision. These are roster cloggers with no pathway to consistent fantasy relevance, and an almost non-existent ceiling outside of an outlier TD spike game.
WR Snap Share Trends
The total snap share over the first four games doesn’t necessarily tell the whole story. The following shows the positive snap share trends among WRs. This is the Top 40 WRs based on the percentage increase in snap share between Week 1 and Week 4 of the 2023 NFL Season. Not every WR on this list has played in all four games, so the trends for players who have missed time are based on the difference between their most recent game and their first game of the season.
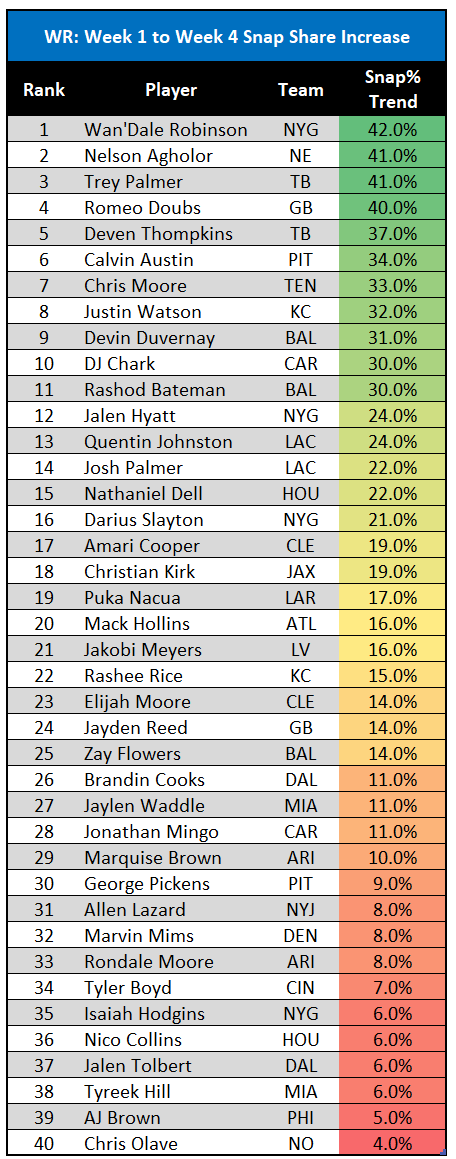
These types of in-season trends will always have lesser-known players included because this is about an increase in snap share, but not necessarily increasing to a point of much relevance for fantasy football. It should also be noted that snap share trends will spike due to injury too. Calvin Austin has seen the sixth-highest increase in snap share since Week 1, largely due to the injury and missed games for Diontae Johnson. Both Quentin Johnston and Josh Palmer’s snap share increased after the season-ending injury to Mike Williams. This is not a knock. Those two Chargers’ WRs should continue to see the field a lot. Some players, such as Devin Duvernay, Jalen Tolbert, and Rondale Moore fit the criteria of the Week 1 to Week 4 increase, but their involvement in their respective teams’ offenses is still such that they fall into the “noise” category. For example, Tolbert has seen a 6% increase, but his Week 4 snap share was only 34%. The Week 1 to Week 4 difference can also be misleading with certain players. Using Tolbert as an example again, if you look at his snap share between Week 4 and his previous game in Week 2 (he missed Week 3), he saw a 34% decrease.
The players who stand out to me in this data set are Wan’Dale Robinson, Romeo Doubs, and Rashee Rice. Robinson’s two-game sample size is small, but it is telling that he went from 22% in Week 3 up to 64% in Week 4. His average depth of target (aDOT) is only at 3.4, but on a team searching for their WR1 (similar to the Chiefs), Robinson is making his case. I realize that the state of the Giants’ offense is rock-bottom right now, but it will not look like the game against the Seahawks every week. Robinson should be rostered in PPR leagues.
Romeo Doubs is a player I am changing my tune on. Probably a little too blinded by draft capital, I faded Doubs over the offseason after the Packers drafted Jayden Reed, as I thought Doubs would be surpassed by both Christian Watson and Reed. It has been the opposite. Yes, Watson played his first game in Week 4 after a hamstring injury and Reed has been decent, but Doubs’ snap share was 40% higher in Week 4 than in Week 1, with Watson on the field. I am fully prepared to accept being wrong on Doubs.
Rashee Rice is somewhat similar to Robinson in that he is in a sea of WR mediocrity and is trending in a positive direction. Rice has not arrived just yet, but he has seen a 15% increase in snap share since Week 1. He has also impressed with his targets per route run (TPRR). His Week 4 snap share was only 46%, which is why I say he hasn’t arrived yet. But with snap shares of 31% in Week 1 and 18% in Week 2, he is showing what you want to see with an unproven rookie WR. His snap shares in the last two weeks were 51% and 46%. Rookies take time to develop and get their NFL legs under them, which is why you commonly hear the advice to target rookies who have not hit consistent fantasy points yet for a potential second-half breakout. That is what I am banking on with Rice.
On the flip side of all this positivity is the other end of the extreme. The following table shows a list of the 40 WRs whose snap share has decreased the most between Week 1 and Week 4.
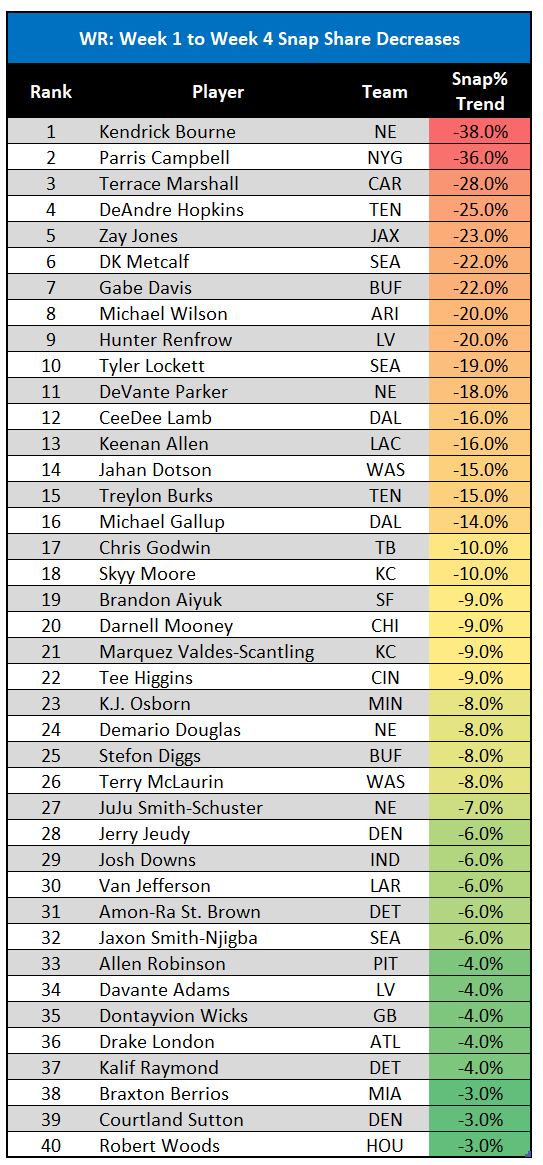
After being a popular waiver add after Week 1, Kendrick Bourne tops this list with a 38% decrease in snap share. This is partially based on the return of teammate DeVante Parker, but also because Bourne has never been a consistent WR or scorer of fantasy points. To expect that to change with Mac Jones after a splashy Week 1 was ill-advised. Parris Campbell comes in second with a 36% decrease, also largely due to the return of a teammate from injury (Robinson). Campbell’s TPRR has improved rather significantly, but that is not surprising as he has been running fewer routes. As with any rate, higher numbers are easier to attain and less predictive of talent/production at small sample sizes. This is also an argument that can be made against Rice’s high TPRR this season.
Terrace Marshall is an interesting case because his snap share has decreased by 28% but his target share shot up to 32.3% in Week 4, an impressive number even for a WR people will have a hard time trusting. Marshall has my attention in that Carolina offense as D.J. Chark’s peripherals have been bad in 2023, as shown in the discussion above about snaps, routes, and targets.
Certain players fit the criteria of this list but the negative snap share being seen as bad is misleading. Michael Wilson’s snap share decreased by 20%. But that decrease was from 90% in Week 1, an emphatic statistical statement by a rookie WR, to 70% in Week 4, a game in which he scored twice. Wilson has one of the higher season-long snap shares of all the rookie WRs. It is similar with some of the other every-week starts you see on this list (Keenan Allen, CeeDee Lamb, DK Metcalf). Yes, their snap share has technically decreased, but not to a concerning level.
RB Snap Share
Here are the Top 30 snap share rates so far (not including Thursday Night Football of Week 5):
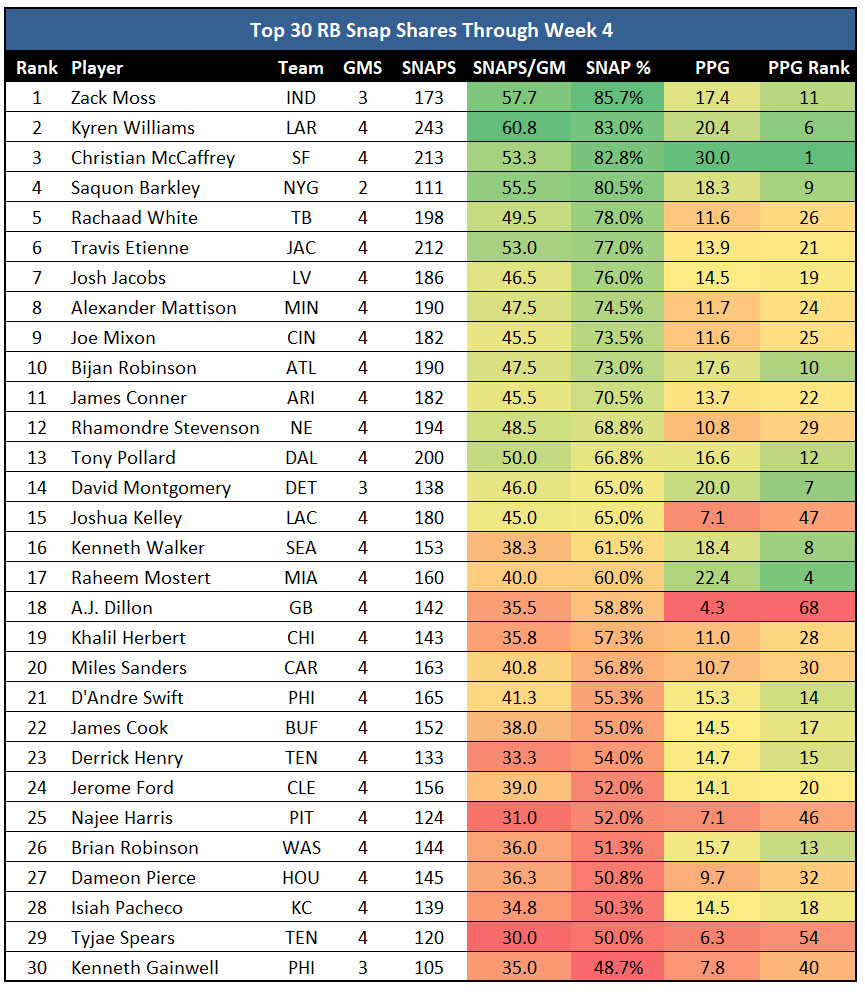
As with WRs, there are not many surprises on this list either. Unlike the WR position, snap share is more directly connected to fantasy points with RBs. You don’t see as many RBs on the snap share leaderboard outside the Top 50 as you do with WRs. If a team chooses to put an RB on the field, that is the RB who will get the ball. However, it is still not a strong correlation. RBs have been scoring more fantasy points with less of a workhorse role for years now. And just because a certain RB is a “lead back” seeing the most RB volume & opportunity for their team, doesn’t automatically make them a proficient fantasy-scoring RB. Only half of the Top 10 snap share RBs are also Top 10 in fantasy points. But there is another factor that adds context as to why.
Here is the same player pool with another metric included: Percentage of fantasy points coming from TDs (%PtTD):
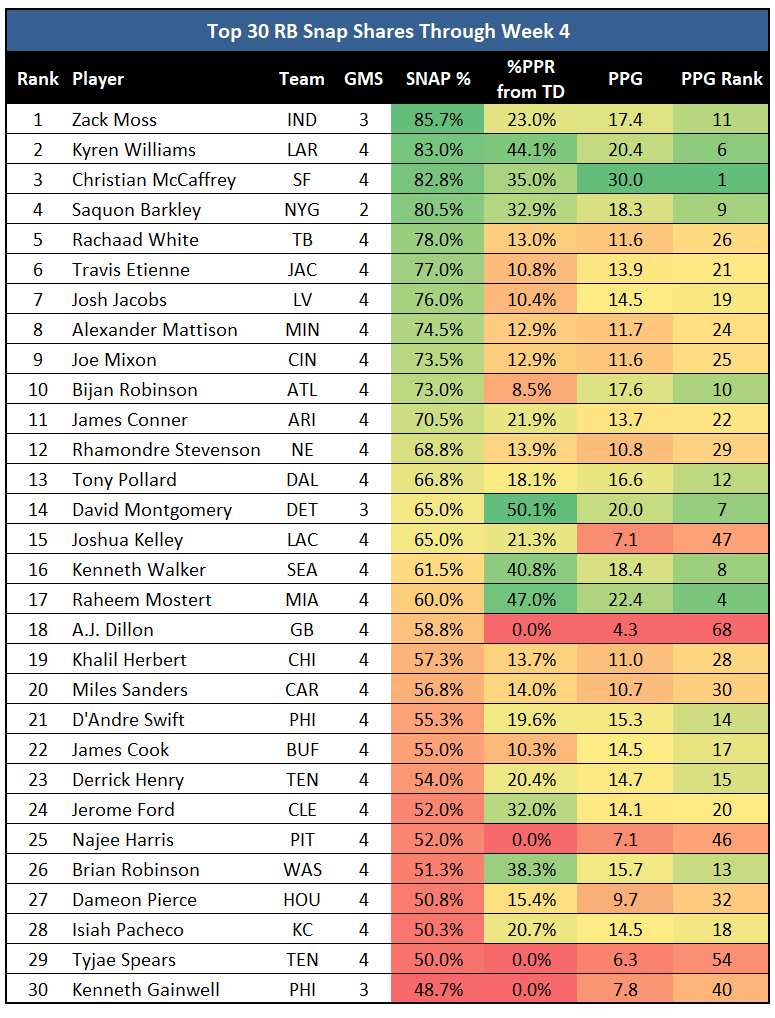
Now you see that color correlation appears with RBs. Like targets with WRs, it’s not rocket science to say RBs who score more TDs also score more fantasy points, but looking at it through this lens ties it directly to a PPG range, and reveals who we might expect to experience positive or negative TD regression.
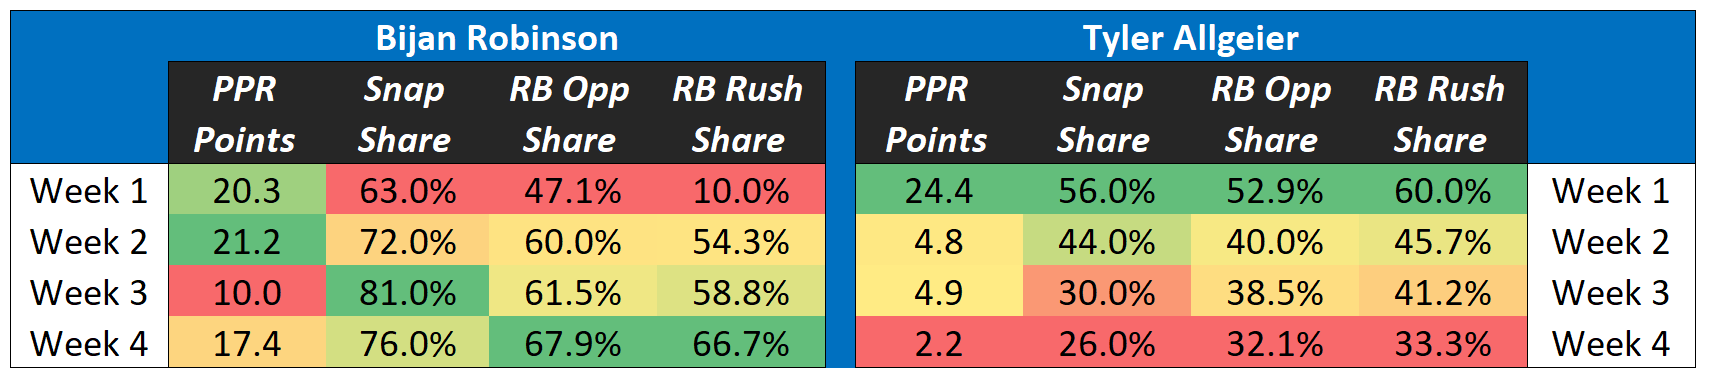
Bijan Robinson jumps off the screen for me. The 10th-highest snap share and also the 10th-most RB fantasy points. But he is one of few whose %PtTD does not line up with his fantasy points. Robinson is the RB10 even with the fifth-lowest %PtTD. Robinson’s TDs will come, and his market share stats have been increasing every week. He’s on the verge of exploding.
David Montgomery, Raheem Mostert, and Kenneth Walker have relied heavily on TDs leading to them being the three Top 10 fantasy RBs with the lowest snap shares. Each of them has another RB eating into their workload, so any negative TD regression will boot them out of the RB1 group. That might sound like a hint to sell high, but I would be holding Montgomery and Walker because I don’t think their TDs will regress much based on their roles in their offenses. But I would sell high on Mostert if I could as he is the least proven of the three, he’s 31, and De’Von Achane is taking over that backfield.
The promising RBs for me are the Top 24 players with relatively low %PtTD. Rachaad White, Josh Jacobs, and Travis Etienne have relatively weak and unproven competition in those backfields, which is supported by their high snap shares. D’Andre Swift and James Cook fit the same mold, just at lower snap shares. Any positive TD regression for these RBs and their value increases up the RB2 ladder, with a potential RB1 ceiling for Jacobs, Etienne, and Swift.
And then there are two RBs who, even with a higher %PtTD, don’t have staying power. Jerome Ford and Brian Robinson Jr. both have a %PtTD above 30%. Ford is the RB20 and Robinson Jr. is the RB13. Other than these two, the lowest fantasy rank for an RB with a %PtTD above 30% is RB9 (Saquon Barkley).
NOTE: I set a minimum of two games played for this player pool, which is why you don’t see Austin Ekeler or Alvin Kamara.
RB Snap Share Trends
The following shows the positive snap share trends among RBs. These are the RBs who have played a minimum of two games and have shown a positive trend based on a percentage increase in snap share between Week 1 and Week 4.
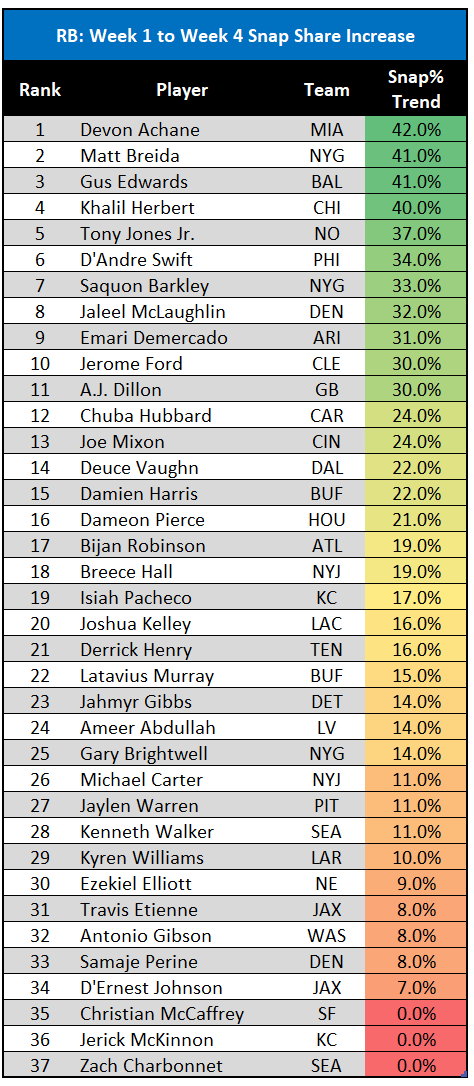
Rookie De’Von Achane sits atop this list as his snap share since debuting in Week 2 has gone 10%, 40%, and 60% over the last three games. You will see later that this has coincided with his counterpart (Raheem Mostert) seeing one of the biggest drops in snap share. Matt Breida and Gus Edwards saw increases in snaps due to injuries to their teams’ starting RBs, and Breida will plummet back down to a backup role with the return of Saquon Barkley. D’Andre Swift’s increase is a bit inflated due to his bizarre lack of usage in Week 1 (29% snap share). But his increase is still a positive, with snap shares above 60% in two of the last three games in what was supposed to be a crowded backfield. Swift is finally being used in a way that his talent can be maximized and is a must-start until further notice.
Jaleel McLaughlin and Emari Demercado fit the mold of seeing snap share increases to fit the criteria, but only because they started the season near 0%. In Week 4, McLaughlin hit only a 33% snap share while Demercado was at 35%. Chuba Hubbard, similar to Achane, has seen his snap share increase (by 24%) while his RB teammate (Miles Sanders) has been going in the opposite direction.
Two RB studs are headed in the right direction as well. Breece Hall has seen a 19% increase, and his usage has increased every game while Dalvin Cook’s has decreased. This was expected with Hall coming back from the ACL injury, but it confirms that he is ramping up. Bijan Robinson has seen his snap share increase by 19%, another confirmatory sign that he is the guy in Atlanta and is also ramping up as most rookie RBs need to do.
Kenneth Walker’s 8% increase is also a good sign for his fantasy season. Walker had a season-low 51% snap share in Week 3 while rookie teammate saw his highest snap share of 43%. Whether this redirection for each Seahawk RB is the new trend or was based on the way the game played out against the Giants I do not know for sure. But the Seahawks stayed with Walker in the 4th quarter when the game was well in hand. This is why Zach Charbonnet’s 0% change is also misleading, as his snap share decreased by 19% from Week 3 to Week 4.
As I did with WRs, here is the opposite end of the RB snap share trend, showing the RBs with negative snap share trends from Week 1 to Week 4. based on decreased snap share since Week 1.
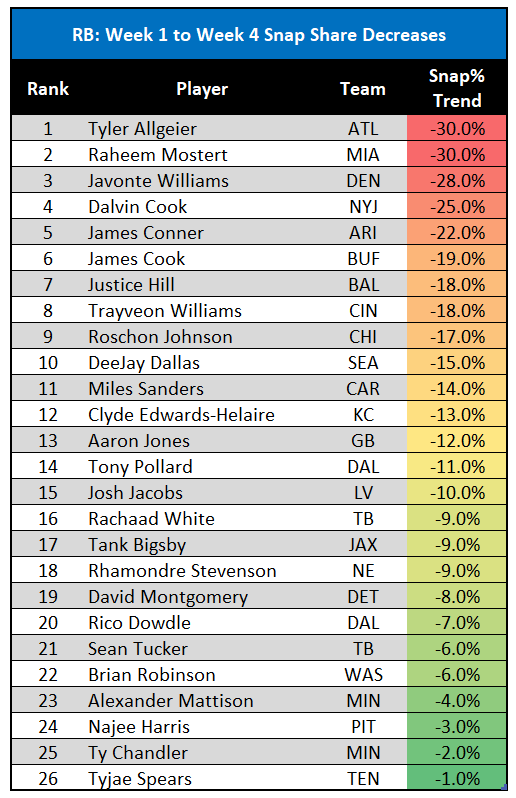
Here you see some of the RBs discussed above, heading in the opposite direction of their positively trending teammates. Tyler Allgeier and Mostert top the list, each seeing a 30% decrease in snap share since Week 1. Roschon Johnson has not started trending upward as many had hoped, but we will have to keep an eye on the status of Khalil Herbert’s ankle. Herbert has stated he’s fine, but that looked like a gruesome injury. If Herbert misses time then Johnson’s usage should skyrocket. If Herbert plays, Johnson remains as a bench stash/lottery ticket.
As with WRs, there are a few must-starts who made this list (Aaron Jones, Tony Pollard, Josh Jacobs, and David Montgomery), but their current snap share and usage are not concerning. It’s just lower than Week 1. Clyde Edwards-Helaire has been seeing the field less while teammate Isiah Pacheco’s snap share has increased by 17%. Pacheco is showing that the fragility of a late-round RB in the NFL is not the case with his role for the Chiefs in 2023.
Thanks for reading! If you have any questions about this article or fantasy football in general, feel free to hit me up on Twitter.