Fantasy Football Beneath the Surface

Fantasy Points Per Game and Strength of Schedule: Top 36 RBs
The crazy NFL train now makes its stop in Week 10. We are into the double-digit weeks. It seems like yesterday we were doing our best to interpret and analyze the first quarter of the season and now we are beyond the halfway point. This season has normalized, at least relative to the major impacts COVID-19 had over the last few years. But like any other season, we have dealt with a slew of injuries to fantasy football stars, bye weeks that can make it difficult to even field a starting lineup (based on your luck/roster construction), and plenty of unexpected (and expected) results. The theme of this article series has been a focus on peripheral and advanced statistics across the fantasy skill position groups, mostly revolving around opportunity, volume, and efficiency. The foundational pieces of the eventual results: fantasy points.
I preach the “jigsaw puzzle” nature of fantasy football analysis. You can see it every week in my intro paragraph. I tend to focus on peripherals because of the usefulness of the data and because I assume fewer people have the time to dig into it. That’s been my main goal since I got into this industry, to try and help other people become better fantasy managers. That is why many analysts commit the time to do what we do, so you don’t have to if you don’t want to. But the results, the fantasy points, are just as much a piece of the puzzle as anything else. And fantasy points scored also have their own set of peripheral statistics.
In this article, I will be looking at the points per reception (PPR) Top 36 RBs, based on fantasy points (FPTS) scored per game (PPG). Along with PPG, I will include another relatively fresh metric in the analytical world: Expected Points (EP). Specifically, I will compare Expected PPG to actual PPG for each player, which produces another useful data point: Fantasy Points Over Expected (FPOE). Expected Points for individual players factor in specific context that attaches varying degrees of value to each opportunity (targets, rush attempts, and receptions). The idea behind EP, FPOE, and another related metric (Expected Points Added (EPA)), is that not all opportunities are the same. Some opportunities are more valuable than others. For example, an RB who gets 10 red zone rush attempts would be more appealing than an RB who gets 10 rush attempts between the 20s. The box score will only show the 10 rush attempts for both players, but the Expected Points would be higher for the RB given the red zone opportunities. There are a variety of variables comprising the recipe for EP:
- Value of rush attempts vs. targets
- Down and distance
- Yard line
- Depth of receiving target
With EP you can calculate FPOE, which shows the players who are underperforming or overperforming in PPG compared to what is expected. Marvin Elequin (@FF_MarvinE on Twitter) with The Fantasy Footballers wrote a great series last offseason explaining EP and FPOE. The article specific to RBs is found here.
In addition to FPTS data, I will also show the fantasy strength of schedule for the Top 36 RBs. Fantasy points allowed per game by each team to each skill position come from FantasyData’s Premium Data. I then adjust those numbers based on the opponent. For example, allowing Derrick Henry and the Titans to score 15 RB fantasy points is not the same as giving up 15 RB fantasy points to whatever is going on in Atlanta. In this hypothetical example, even though both teams allowed 15 RB fantasy points to the RB position, the first team is ranked higher due to strength of opponent. Strength of schedule includes:
- Rank based on adjusted fantasy points allowed (PPR), to date (Weeks 1-9)
- Rank based on adjusted fantasy points allowed (PPR), rest of season (Weeks 10-17)
- Rank based on adjusted fantasy points allowed (PPR), playoff schedule (Weeks 15-17)
For the charts in this article, the column by which the data is sorted will have a yellow-highlighted column title.
Top 36 RBs: Fantasy Points, Expected Points, and FPOE
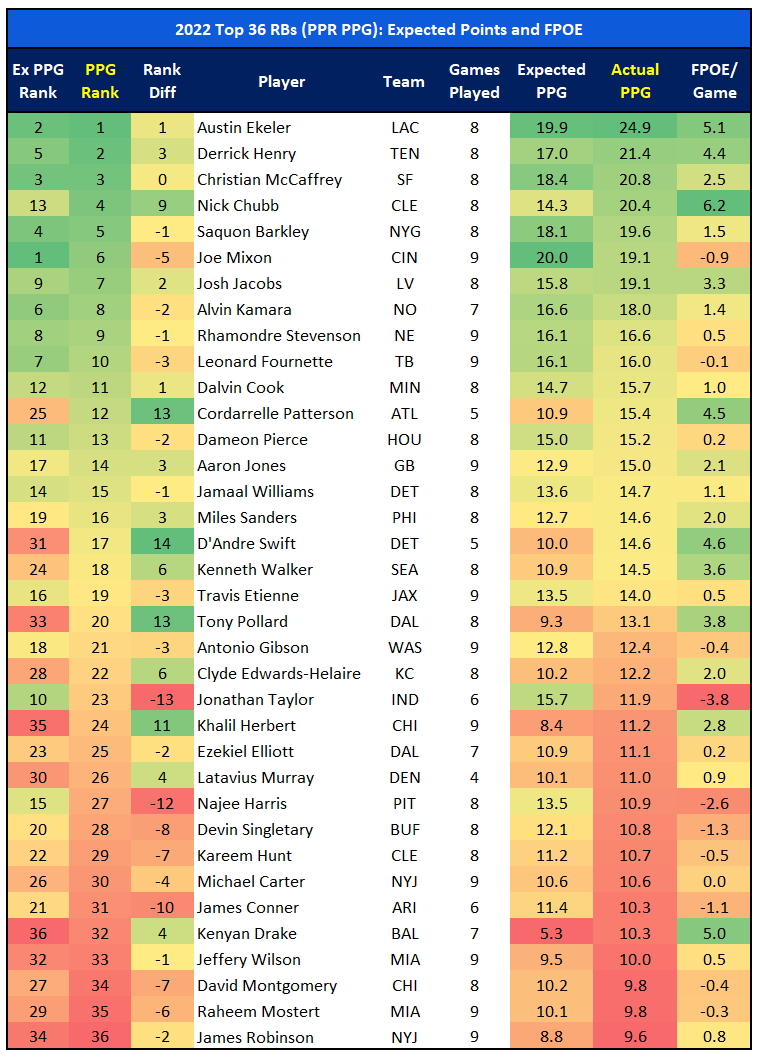
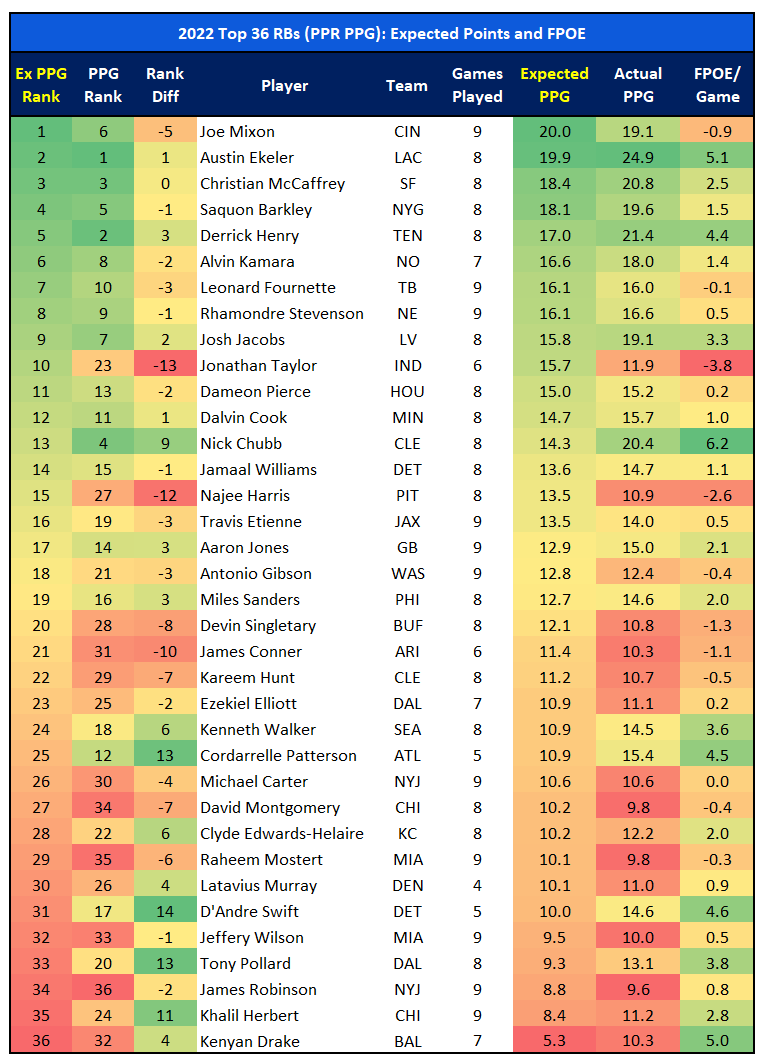
The first chart is sorted by actual PPG, followed by the same data sorted by Expected Points so you can see what the Top 36 RBs would look like only looking at the expectations. This Top 36 is based on a minimum of four games played, and Rashaad Penny, Javonte Williams, and Breece Hall are not included due to being out for the season with injuries.
There are currently four RBs averaging 20+ PPR PPG, which is right around the average. According to FantasyData, since 2012, there have been an average of 3.2 RBs to finish at 20+ PPR PPG each season, with a low of only one in 2012 and 2015, and a high of eight in 2018. Rhamondre Stevenson being in the Top 10 is awesome (I love Rhamondre) but I was not expecting that. However, this data shows that he’s been performing as per the Expected Points of his opportunities, with an FPOE of only 0.5.
Nick Chubb is arguably the best pure runner in the NFL (I would argue it), but based on his historical sharing of the Browns’ backfield, it is surprising to see him as high as the RB4. Since his rookie year in 2018, Chubb’s average PPR finish is RB13.8. And while it seems like Chubb is seeing a larger share of the RB market this year, that isn’t really true. Chubb’s average opportunity share from 2018-2021 was 57.9%, with spike data when Kareem Hunt missed games. His opportunity share through Week 9 is 60.1% (according to FantasyData). So a slight uptick but this alone doesn’t explain his ascension up the leaderboard. EP and FPOE data help to explain why. Chubb is ranked nine spots higher in actual PPG than what is expected and has the highest FPOE at 6.2 PPG more than expected. That is a significant “per game” number. You can see his expected rank is RB13, right at his historical average. You do have to be careful putting too much weight on a positive FPOE, as it can also indicate an overperformance that is likely to regress. We will see if anything significantly changes when Deshaun Watson takes over at QB in Week 11. Chubb’s TD rate (TDs divided by rush attempts) is slightly higher (6.7%) than his historical average (5.3%), but he has had seasons with an 8.7% rate (2018) and 6.3% rate (2020), so I don’t think Chubb is a candidate for major regression there. With an eight-game sample size, I think Chubb is bucking the typical knock on him in PPR formats and will finish the season as a Top 5 RB.
Kenyan Drake is a less-obvious name that stands out in this data. Drake has the third-highest positive FPOE per game at 5.0 points than expected, taking him from the expected RB36 to RB32. This isn’t league-winning material, and Drake’s fantasy value is directly tied to J.K. Dobbins’ health, but he’s performed better than expected and should remain a serviceable flex option and bye week fill-in as long as Dobbins is out.
Jonathan Taylor stands out for the wrong reasons on this chart. The 2021 RB1 and many managers’ first overall pick in one-QB leagues, Taylor has been a major disappointment outside of Week 1. Taylor’s Expected Points would have him at RB10. Even that would be disappointing based on his cost. But Taylor has both the largest drop between Expected Points and actual PPG and the lowest FPOE per game of the Top 36 RBs. Now, the Colts have evolved into a dumpster fire in 2022. Frank Reich is out as Head Coach and many think the Colts are not-so-inconspicuously tanking. Taylor has missed games with injury and has not been 100%, but regardless of why he has underperformed so significantly up until this point, the current state of that team does not bode well for Taylor turning it around in 2022.
Najee Harris is another RB significantly underperforming this season. This isn’t news, as the rumors of undrafted rookie Jaylen Warren cutting more into the RB workload have been swirling. The Steelers are a team in transition and all of their fantasy skill position players have taken a hit this season. But Harris is only slightly behind Taylor in negative RB rank difference and negative FPOE. The other underperforming RBs with a negative FPOE less than -1 include Devin Singletary and James Conner.
Top 36 RBs: RB Rushing and Receiving FPTS Breakdown
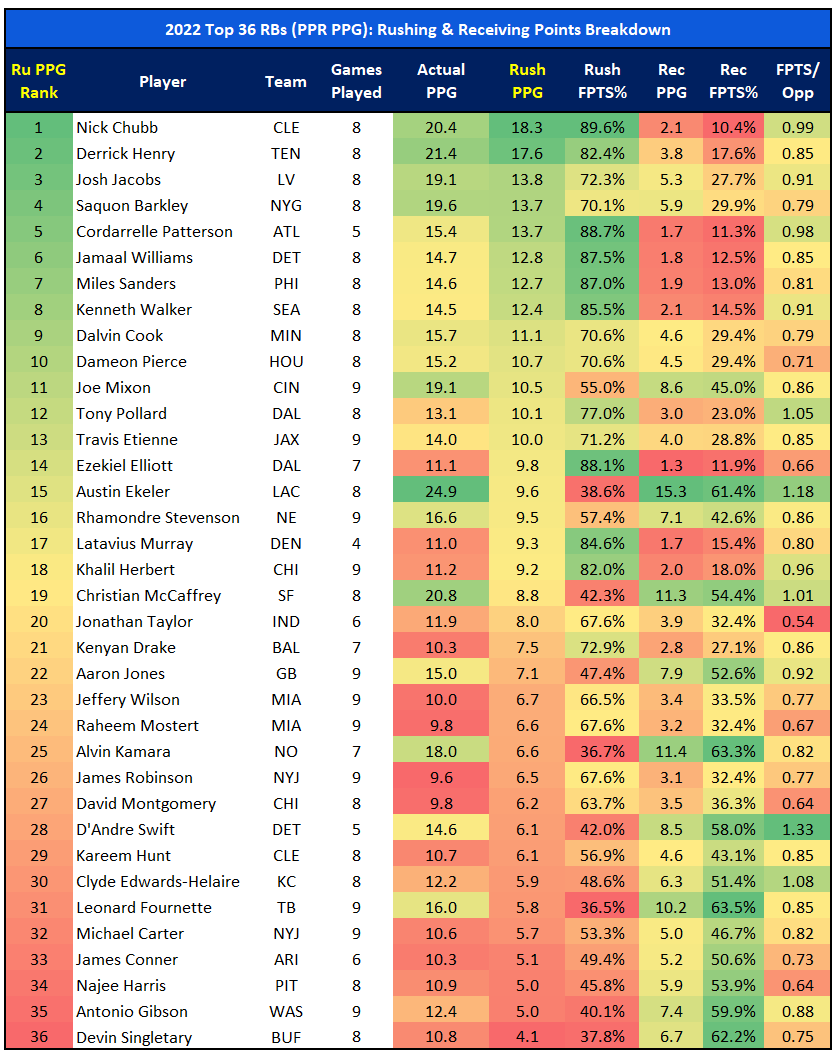
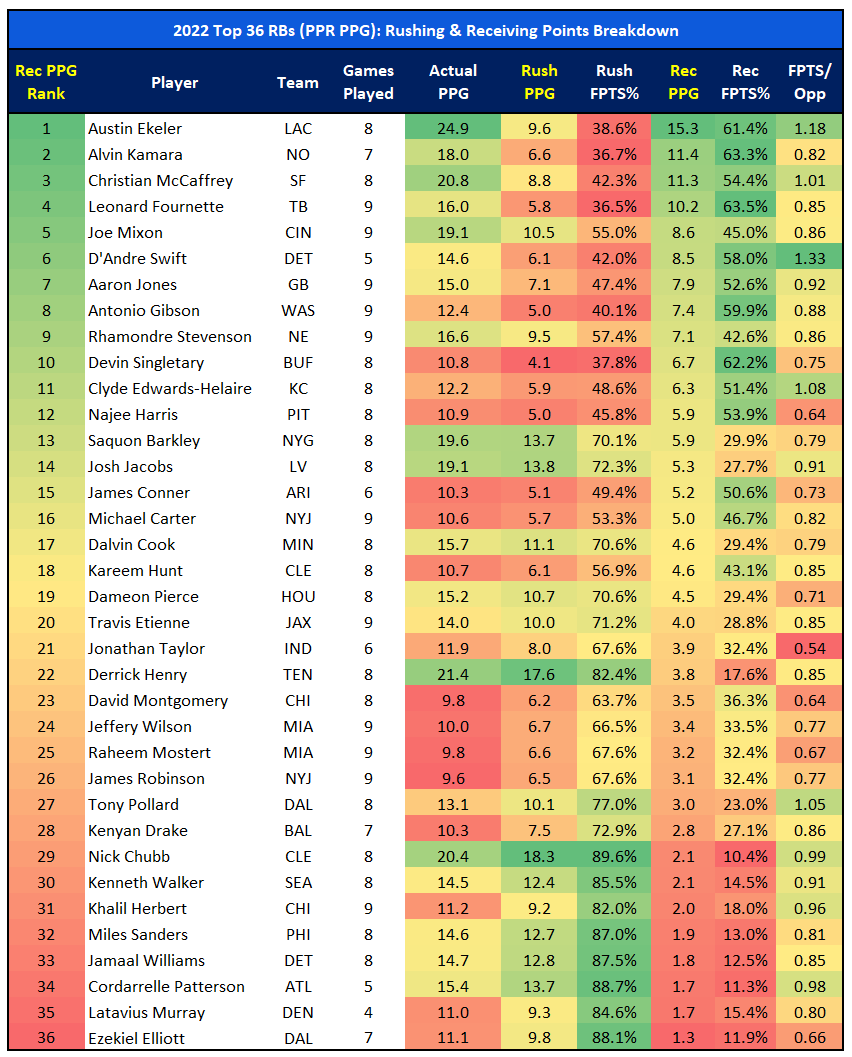
The second set of charts breaks down each RB’s fantasy scoring into rushing and receiving points. The first chart is sorted by RB rushing PPG and the second is sorted by RB receiving PPG.
This data shows which RBs are more reliant on rushing yards and rushing TDs versus receptions, receiving yards, and receiving TDs for their fantasy points. This conveys useful information when looking at things like expected game scripts. Outside of Chubb and Derrick Henry, most of the RBs relying on rushing for 80%+ of their FPTS will be negatively impacted by a negative game script. The main reason I included this data is it transitions well into the fantasy strength of schedule which is also broken down by fantasy points allowed to RBs on the ground and through the air.
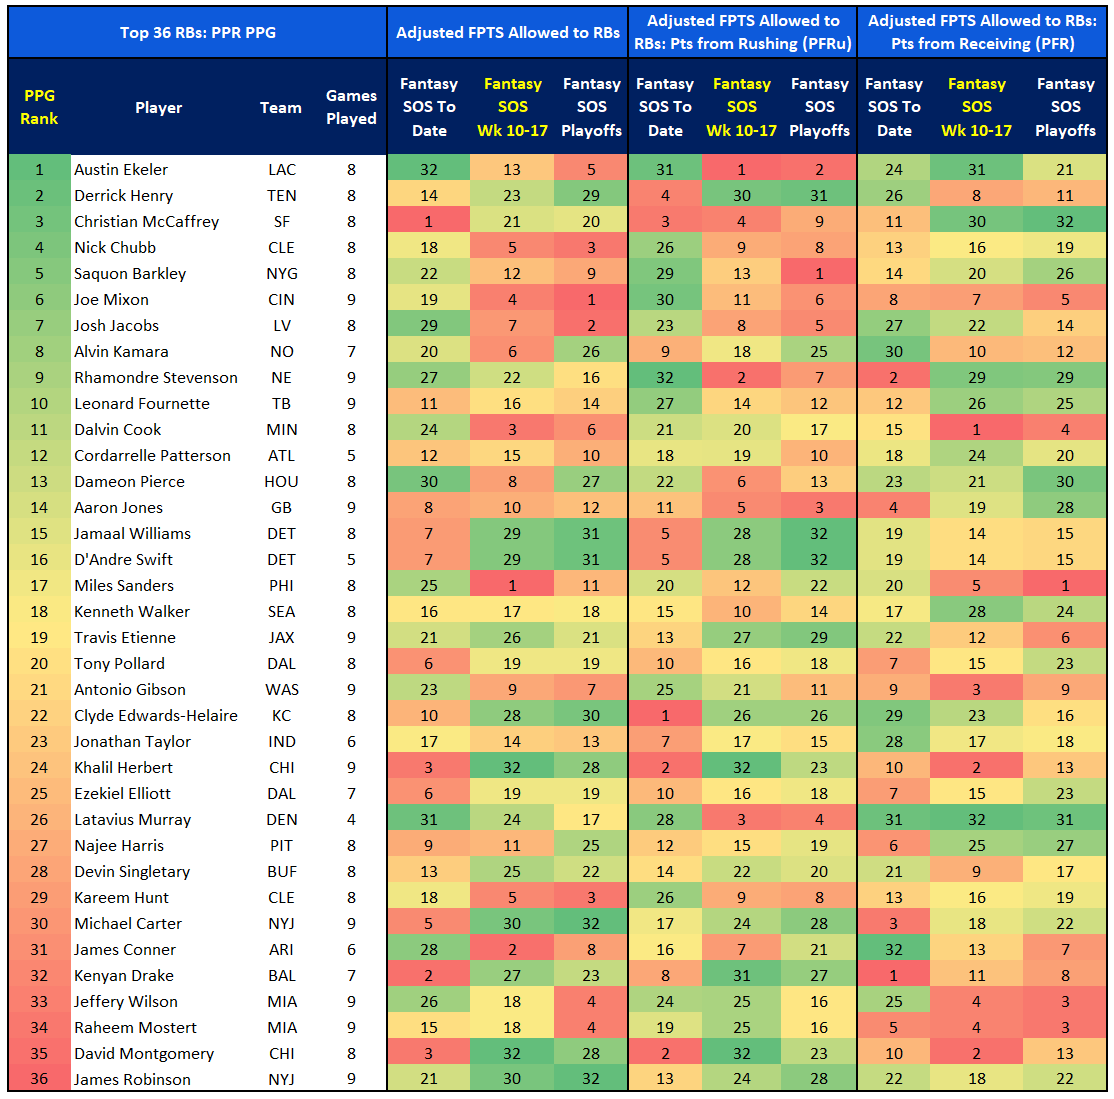
Top 36 RBs: Fantasy Strength of Schedule (SOS)
The RB strength of schedule is broken down further, showing opponent ranking in adjusted fantasy points allowed per game to:
- Overall RB fantasy points
- RB fantasy points from rushing only (PFRu)
- RB fantasy points from receiving only (PFR)
Each team’s fantasy strength of schedule for the RB categories listed above is broken down into three time frames:
- SOS To Date (Weeks 1-9)
- SOS Rest of Season (ROS) (Weeks 10-17)
- SOS Fantasy Playoffs (Weeks 15-17)
For the “To Date” SOS, I assigned the former team’s schedule to recently traded players (Christian McCaffrey and Jeff Wilson). For instance, as you will see, the Panthers have had the toughest “To Date” SOS for RBs, so it is more accurate to use this for Christian McCaffrey, as that is mostly the schedule he has faced to arrive at his current RB3 rank. But McCaffrey’s ROS and Playoff SOS are based on the 49ers’ remaining schedule.
In this ranking format, a lower number represents fewer FPTS allowed per game (red color) and, therefore a tough SOS, and a higher number represents more FPTS allowed per game (green color), and, therefore a fantasy-friendly SOS.
I realize this includes a lot of numbers, so the first thing to do is familiarize yourself with the three categories running across the top. Then within each category, you’ll see the different time frames. Look for high number, green-shaded cells.
A good starting place is at the top with Austin Ekeler. According to my adjusted FPTS allowed system, the Chargers have had the easiest schedule so far for RBs overall. Looking ahead, that is about to change. ROS, the Chargers’ SOS is 13th, much tougher than the “To Date” rank of 32nd (easiest). And their Fantasy Playoff Schedule is the fifth-toughest. However, and this is where it gets fun, if you move over to PFRu (rushing stats only), that is where the Chargers’ schedule is brutal. When looking at adjusted fantasy points allowed to RBs via PFRu, the Chargers have the toughest ROS schedule and the second-toughest Playoff Schedule. Now move over to PFR. The Chargers have the second-easiest ROS SOS and the 21st-ranked Playoff Schedule. Why is that so important here? Look back up to the RB fantasy points breakdown. Ekeler leads the NFL with 15.3 PPG via receiving, comprising 61.4% of his fantasy points. On the surface, Ekeler’s schedule looks brutal, but when you combine how Ekeler scores his fantasy points with his remaining opponents’ propensity to give up fantasy points in that manner, he has a very good fantasy schedule.
It is similar with McCaffrey in San Francisco. The 49ers have a decent ROS and Playoff Schedule for overall RB. But look at their schedule for PFR. The 49ers have the easiest playoff schedule when looking at adjusted FPTS allowed to RBs via PFR. If McCaffrey stays healthy he very well could bring you a championship with 54.4% of his FPTS coming from receiving.
Another interesting player based on schedule is Jamaal Williams. D’Andre Swift is back from his injury. I am not sure how close to 100% he is, but he’s active. But the Lions have shown they like using Williams as their hammer. The Lions have one of the most fantasy-friendly ROS and Playoff schedules for PFRu, which is where Williams is primarily used.
Rhamondre Stevenson is interesting here as well. Stevenson has relied on rushing (57.4% of FPTS) more than receiving so far this season, but the Patriots have faced the second-toughest schedule “To Date” in adjusted fantasy points allowed to RBs via PFR. Stevenson has shown he has the receiving chops, and their PFR schedule is fourth-easiest (29th) both ROS and in the Fantasy Playoffs. It is the opposite for PFRu. The Patriots have had the easiest schedule “To Date” in adjusted FPTS allowed to RBs via PFRu, but their ROS and Playoff PFRu schedules are second and seventh-toughest, respectively.
I have tried to sell Joe Mixon in a few redraft leagues after his 50+ PPR point outburst in Week 9. Part of my reasoning is the Bengals’ schedule. So far, the Bengals’ SOS is ranked 19th versus RBs (overall) and third-easiest (30th) versus RB via PFRu. Mixon has been more involved in the receiving game this year, but even with that “To Date” schedule Mixon is still at a -0.9 FPOE per game. The RB SOS for the Bengals tightens up both ROS and during the fantasy playoffs, with the sixth-toughest playoff schedule for PFRu and the fifth-toughest playoff schedule for PFR.
On a team level, I broke down each team’s remaining SOS showing each opponent and their rank:
🚨Fantasy Strength of Schedule vs RBs🚨
I posted some of these positions already but wanted to include the SOS to the different RB categories in one place.
ROS SOS for each team in FPTS allowed to:
RBs (overall)
RBs (PFRu)
RBs (PFR)RB overall ⤵️ pic.twitter.com/nX0ojYz136
— Scott Rinear (@MunderDifflinFF) November 11, 2022
Next week I will be covering these same topics but with WRs and TEs, and (space-permitting), QBs and DSTs.
Thanks for reading! If you have any questions about the data used in this article or about fantasy football in general, feel free to hit me up on Twitter.

