Fantasy Football Beneath the Surface
Another week of NFL football, another pile of data to sift through looking for clues. Clues as to what leads to certain results and clues for speculating what might be coming next. They say, “looks can be deceiving.” The same can be said for surface-level statistics in fantasy football. In this weekly article series, I will be looking beneath the statistical surface, beyond the standard box score, using the premium statistics provided by FantasyData, including advanced and efficiency metrics across the fantasy skill positions, to search for puzzle pieces that fit together.
Peripherals
Week 5 of the 2022 NFL season is upon us, which is when I typically start digging into some of the peripheral statistics accumulated over the first quarter of the season. Four games are not a large sample size, but it is enough data to start looking for patterns and takeaways within the peripherals for the fantasy skill positions now that fantasy points leaderboards are taking form and some of the early season, one-game spike weeks that make leaderboards look bizarre start to fall away.
In this article I will be looking at the current Top 50 WRs and Top 24 TEs (PPR format) by revisiting many of the metrics I highlighted in my first article for FantasyData, available here:
https://fantasydata.com/wr-market-share-statistical-breakdown
I recommend you read that article as I explained some of the metrics more than I will in this article. In that article, I looked at the results of the 2021 season.
The following are the statistics used in this article across the Top 50 WRs and Top 24 TEs heading into Week 5:
- Targets
- Targets per game
- Routes per game
- Snap share
- Routes per snap
- Route participation
- Targets per route (target rate)
- Target share
- Receiving yards per team pass attempt (YPTPA)
- Receiving yards per route run (YPRR)
- Weighted Opportunity Rating (WOPR)
- Air yards share
- Average depth of target (aDOT)
- YAC per target
- Fantasy points above expected (FPOE, data from Rotoviz.com)
- TD rate (receiving TDs divided by total targets)
I realize this is a relatively long list. A mixture of volume/opportunity and efficiency metrics, I have found that this grouping of statistics can be useful in multiple ways. The stud-level, top-scoring players typically have very good peripherals across most of these statistics, which is represented in the data. Not rocket science, but it does attach partial validity to their relative predictability. I say relative because, as I have been saying throughout my writing, there are many pieces to the puzzle. You will see that higher scores across these specific metrics do not necessarily translate into fantasy points. And vice versa. Some players begin to stand out as either overperforming or underperforming from a fantasy points-scored angle, which allows us to start asking why that is. You will see that Kyle Pitts has solid peripheral statistics but currently sits at TE19. What factors outside of this data set might explain his underperformance, and might those factors change? Is it simply regression and we just need to be patient? With an overperformer, can they sustain what they have shown or are they taking a next step we might not have expected? These are the types of questions I choose to ask every week.
WR Peripheral Statistics
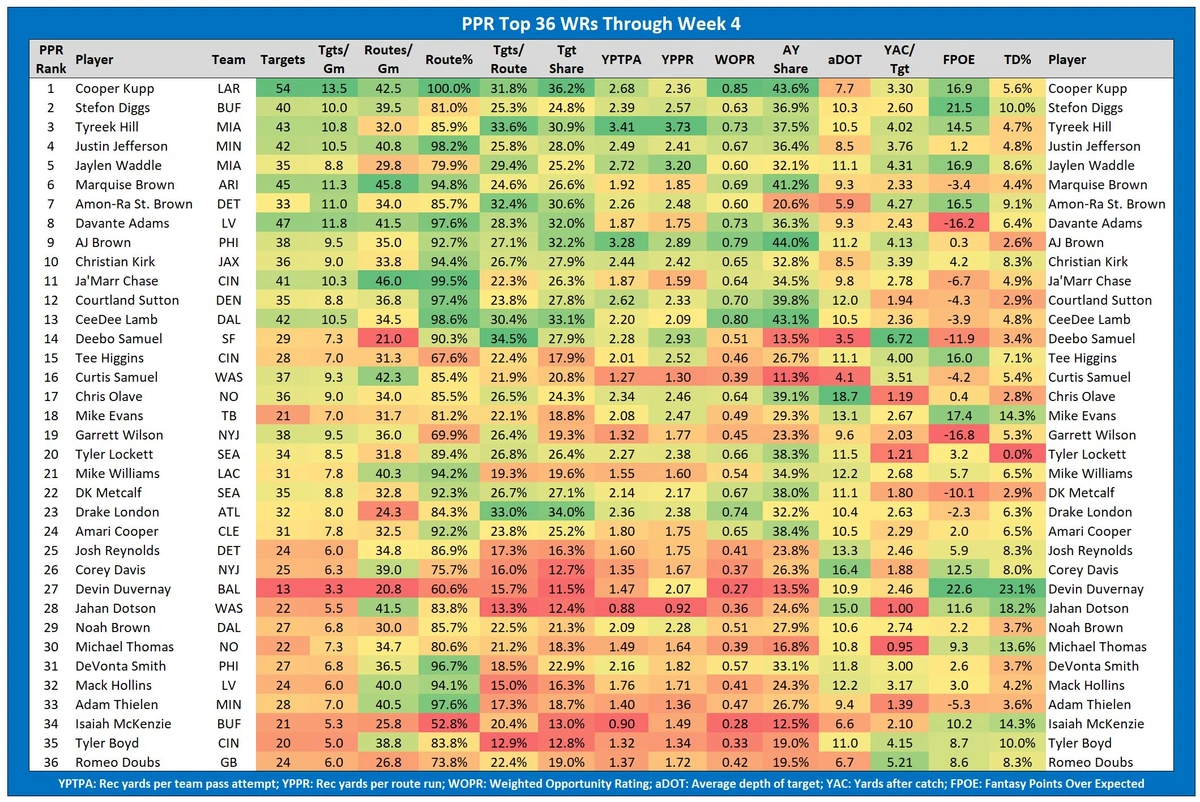
Starting with WRs, here are the current Top 36 WRs in PPR fantasy points scored entering Week 5:
 Sign Up Today To Continue Reading…
The rest of this article is for FantasyData Subscribers only. Luckily for you, now is one of the best times of the year to subscribe. We are offering amazing deals on our Annual subscriptions. That means you get all our awesome DFS content, projections, rankings, and tools along with downloadable data for one full year. You will be set up for the rest of this NFL season and almost all of next year!
I keep it simple with conditional formatting. Green means higher scores, and red means lower scores. Green means good, and red means bad. So, you can see what I mean by the upper-echelon WRs doing well in these categories. Cooper Kupp doesn’t need to be discussed, but his numbers are ridiculous. The highest target share since 2014 was 35.4%, by Davante Adams in 2020. Kupp’s 36%+ target share might not be sustainable over a full season, but he is already so far, somehow, besting his 2021 season, so if anyone is going to maintain that level it’s Kupp. The other indication of the sustainability is comparing Kupp’s share of the Rams’ air yards (43.6%, second highest) to his aDOT (7.7, 31st). Typically, a low aDOT does not translate to a high air yards share. The only way that happens is with a massive amount of volume. The other player showing this discrepancy (which is a good thing) is Marquise Brown, with an aDOT under 10 but one of only four WRs with an air yards share above 40%.
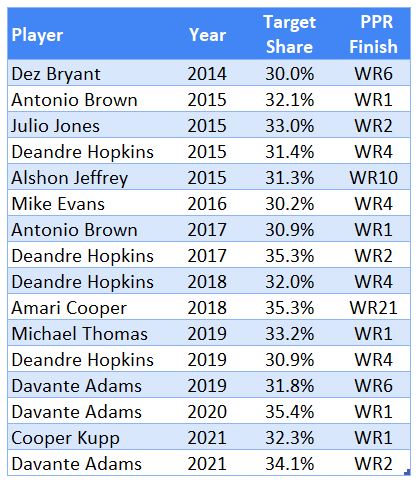
Another player who stands out here is Drake London. Looking across these metrics with London, his current overall WR23 seems low. Top 12 in YPTPA, YPRR, and WOPR, London also boasts the second-highest target share (34.0%) behind only Kupp. And like Kupp, I don’t see a reason why that target share would decrease in Atlanta. And if he maintains a 30%+ target share I expect him to finish much higher than WR23. Since 2014, a WR has finished with a target share at or above 30% 16 times. Only one finished outside the Top 10 in PPR points per game. As mentioned, Amari Cooper is tied with Hopkins for the highest target share of the last eight years. But Cooper finished as the WR21 when he hit that mark in 2018. Fifteen of the 16 finished in the Top 10, and 14 of the 16 finished in the Top 6.
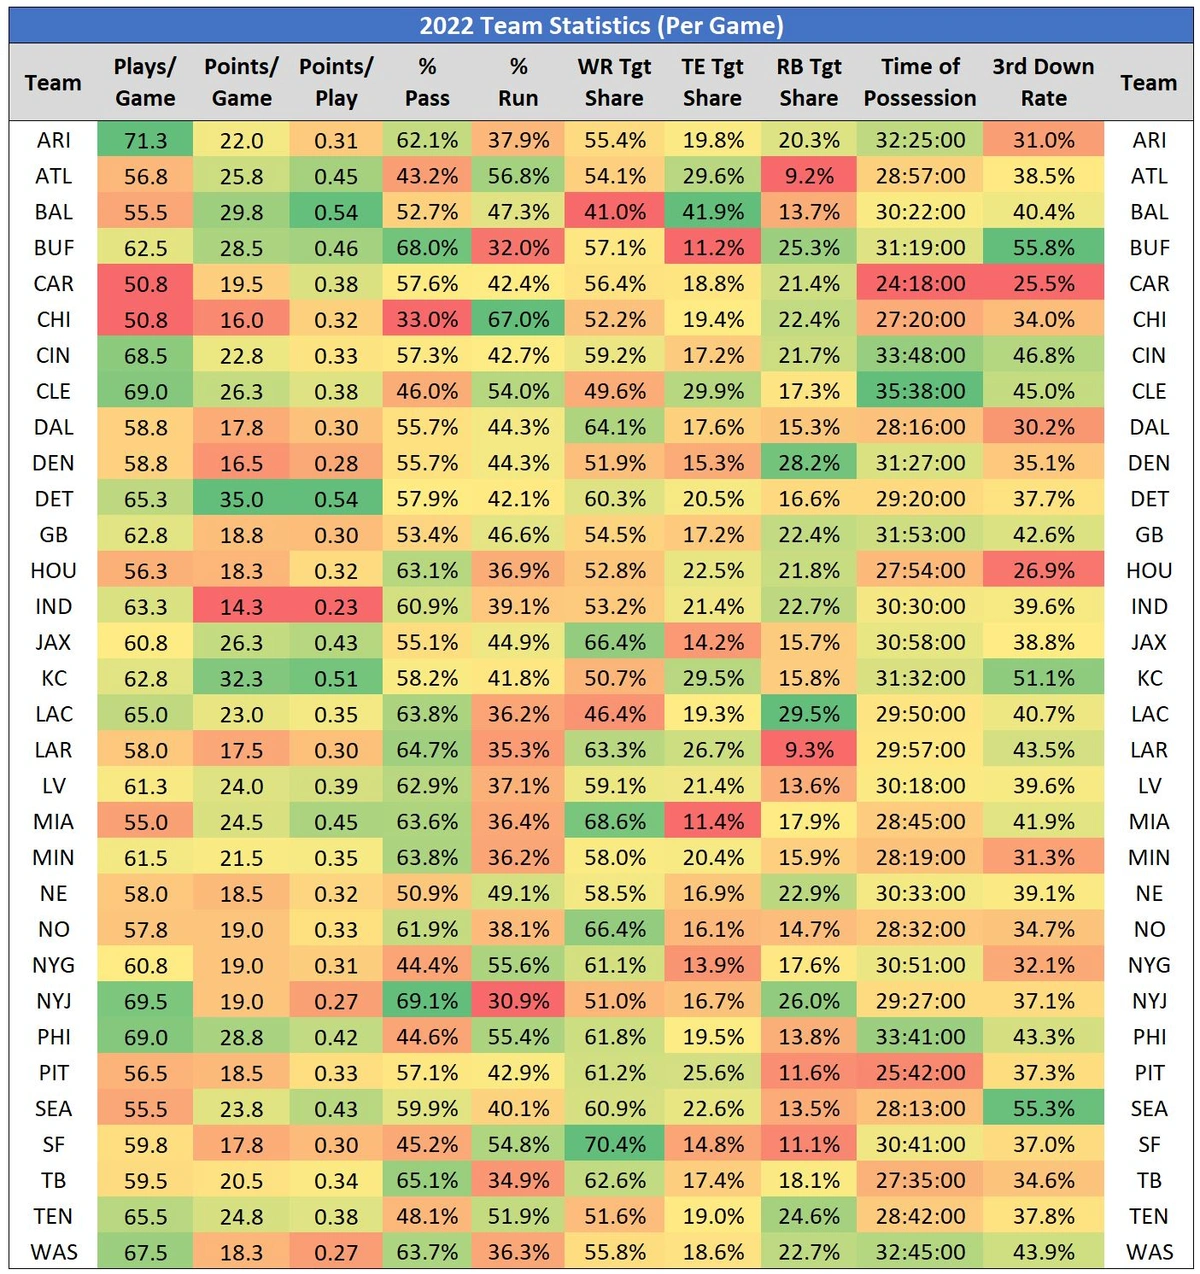
So why isn’t London higher in fantasy points with those peripherals? The reason is similar to another pass catcher in Atlanta with solid peripherals: a relative lack of volume and opportunity. The only “reddish” numbers for London involve routes. Among the Top 36 WRs, only Deebo Samuel and Devin Duvernay have run fewer routes per game. London’s market shares are elite, but the market in Atlanta is far from it. The Falcons have run the 6th fewest plays so far (56.8 per game), have the league’s lowest pass rate at only 43.2%, and are 21st in time of possession. That is a recipe for a terrible market for the Falcons’ pass catchers. Maybe that changes with Cordarrelle Patterson on IR, but the Falcons seemed fine rolling out rookies Tyler Allgeier and Caleb Huntley in the same heavy run scheme after Patterson went down in Week 4.
CeeDee Lamb is also putting together a solid season and is another WR whose peripherals point toward a higher finish than his current WR13 standing. Now, Lamb did drop a walk-in TD in Week 3 that I could have caught. If he scores there, he’s around WR6 right now. But his numbers are impressive across the board. Most of his numbers are pretty close to Kupp’s, with the second-highest target share, second-highest WOPR, third-highest route participation, and third-highest air yards share.
Christian Kirk is a new member of the Top 12 and based on his peripherals and the relatively pass-happy offense in Jacksonville, he has staying power there.
The biggest standout on the over-performance side is Devin Duvernay. In fantasy football we want TDs, so I understand using the scoring of TDs as a knock seems counterintuitive. But with Duvernay it’s blatantly obvious when looking at this data. His numbers are red across the board except for a few categories: TD% and FPOE where he leads all other Top 36 WRs. Duvernay is a player to monitor because he looks to be the WR2 in Baltimore, but unless his opportunity increases (currently 3.3 targets per game) there is no way he can maintain a 23.1% TD rate and 4.1 PPR fantasy points per target.
TE Peripheral Statistics
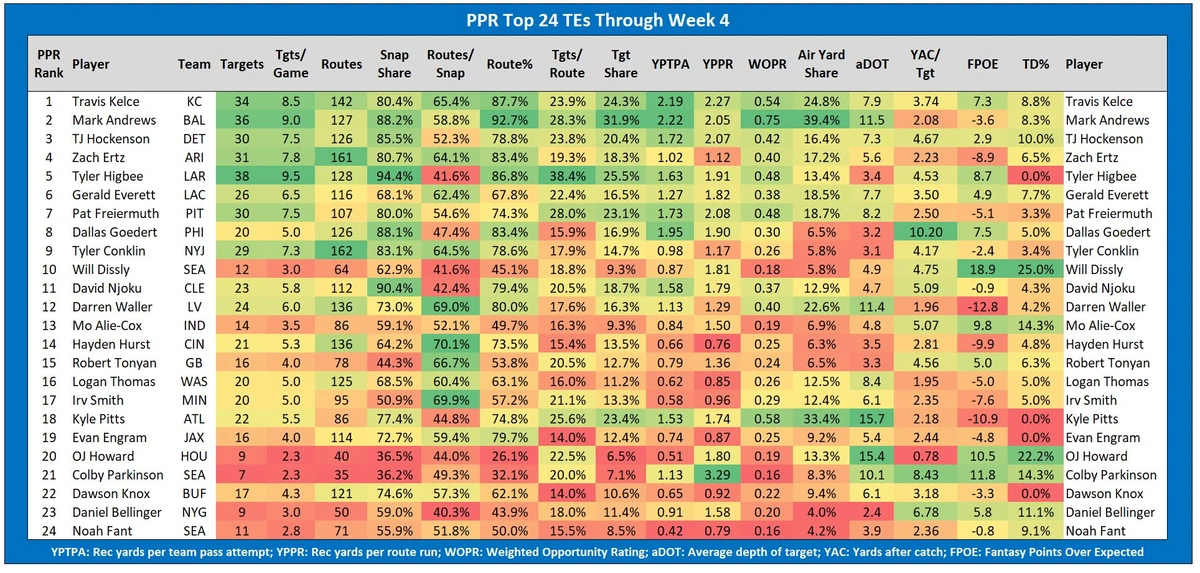
Here are the Top 24 TEs in PPR fantasy points scored entering Week 5:
No surprises with the top two TEs. Travis Kelce and Mark Andrews are the cream of the crop right now and are both the number one pass catchers on their respective teams. And you can see how they both dominate with this data set. However, the rest of the Top 10 is not what I expected. Zach Ertz and TJ Hockenson were both ranked in the Top 10 coming into the season, but the Top 5 exceeds expectations. Hockenson did skyrocket up the rankings on the back of a monster game in Week 4 (179 yards and two TDs) in which three other Lions’ pass catchers were out with injuries, but his peripherals are impressive. He may finally put together a season at least in the ballpark of what we’ve hoped for since his rookie season.
Ertz feels like he’s been in this conversation for a decade, but his current overall TE4 doesn’t seem to be fluky based on these metrics. My only concern about Ertz maintaining this is him having one of two sub-20% target shares in the Top 6 and what kind of a hit his general volume might take when Hopkins comes back. But, even at TE4 his FPOE is -8.9 so he’s looking like one of the few TE steals if you got him in the TE8 range in the draft.
I’ve written and talked about Gerald Everett as a sleeper, a good later-round TE target, so I’m allowing myself to be correct on that call (for now). And Tyler Higbee fits that bill too, commonly drafted outside the top 15 TEs, his usage has been elite. Higbee is the TE5 without a TD yet, which is crazy. I am not sure Higbee can maintain his current opportunity/volume pace, but Cooper Kupp seems virtually unstoppable, so as teams continue to try and stop him, Higbee will likely remain heavily involved for the Rams, a team that has a 64.7% pass rate (4th highest), 26.7% TE target share (4th highest), and the league’s second-lowest RB target share (9.3%).
Pat Freiermuth is a TE breaking out before our eyes. Freiermuth sits at TE7, and that’s with having caught passes mostly from Mitch Trubisky. Kenny Pickett might be a rookie, but he is an upgrade for all of the Steelers’ pass catchers. Freiermuth put together a solid rookie season for TE, in which he finished as the PPR TE15 (PPG), secured a 12.3% target share, averaged 1.23 YPRR, and averaged one TD for every ten targets (unsustainable). In 2022, his target share has jumped to 23.1% (5th highest), YPRR to 2.08 (3rd highest), and is at TE7 with only one TD catch so far. My concern with Freiermuth coming into the season was volume and a slight TD reliance on 2021. Through four games he has alleviated those concerns.
There is only one TE who has played all 4 games, who is top 5 in:
-Yards per team pass attempt
-Target share
-Air yards share
-Yards per route runBut has a negative Fantasy Points Over Expected (FPOE).
His name is Pat Freiermuth
Currently the PPR TE7, Muth is gonna climb pic.twitter.com/tjybWzeB15
— Scott Rinear (@MunderDifflinFF) October 6, 2022
The overperformers are obvious with TEs as well and are much the product of the relatively small sample size. Will Dissly is the TE10 on only 12 total targets and a 9.3% target share. It’s the Devin Duvernay logic with Dissly too. He leads all the Top 24 TEs in FPOE and has an anomalous 25% TD rate. Mo Allie-Cox is also a likely candidate to fade out of the Top 15 unless his volume increases because his peripherals are below average and is at TE13 largely due to a two-TD game in Week 4.
Another statistic to pay attention to with TEs is routes per snap. A TE’s snap share only tells part of the story. Generally, there are two reasons a TE would not run a route on one of their snaps: it is a running play or they are staying in line to block on a passing play. Irv Smith Jr. only has a 50.9% snap share, but he has the second-highest routes per snap rate (69.9%) behind Hayden Hurst (70.1%). You want to see your fantasy TE above 50% in this category, ideally above 60%. Anything lower and you need them to be on the field more (higher snap share). A 90%+ snap share is a part of why both Tyler Higbee and David Njoku are off to solid fantasy seasons even with routes per snap rates in the low 40% range. This is an area holding back Kyle Pitts. He is being asked to stay in and block much more often than last season with a routes per snap at 44.8% (6th lowest) which cuts into his opportunity in an already poor passing market (see above discussion about Drake London). Pitts’ peripheral statistics are solid, but without a spike in TDs, Pitts may be stuck in mediocrity this season unless either the passing volume or his opportunities (which start with running routes), or both, increase.
Team Usage and Opportunity Data
Throughout this article, I’ve referenced different team statistics to provide useful context as to the “why” certain results may be happening or whether certain trends are likely to continue. The following is a summary of the team “per game” data I track and use every week, including:
- Plays per game
- Points per game
- Points per play
- Pass rate
- Run rate
- WR target share
- TE targets share
- RB target share
- Time of possession
- Third down conversion rate
Thanks for reading! If you have any questions about this used in this article or about fantasy football in general, feel free to hit me up on Twitter.


