
Fantasy Football Beneath the Surface
Another week of NFL football, another pile of data to sift through looking for clues. Clues as to what leads to certain results and clues for speculating what might be coming next. They say, “looks can be deceiving.” The same can be said for surface-level statistics in fantasy football. In this weekly article series, I will be looking beneath the statistical surface, beyond the standard box score, using the premium statistics provided by FantasyData, including advanced and efficiency metrics across the fantasy skill positions, to search for puzzle pieces that fit together.
Hold the Line
Week 7 of the 2022 NFL Season is upon us. As we rapidly approach the season’s half-way point, some of the tumultuous early season results have been stabilizing. The first few weeks of a fantasy season will always see surprising names jumping to the top of leaderboards, while some “studs” leave us questioning our draft choices. It is inevitable because of the way fantasy success is measured. Touchdowns and big games from “out of nowhere” players can skew the perception of what is likely to happen as the sample size grows. As the offseason comes to an end and we tell ourselves to not overreact to the first few games, it becomes easier said than done once the action starts. After months of speculating and forming visions of how things will play out, it is difficult to remain patient and hold the line once we go from zero NLF games in six months to 16 NFL games in four days.
RB Opportunity Share (OS)
But now we are to Week 7. Certain players we spent high draft capital on, who got off to slow starts, are now finding their groove. In this article, I will be discussing RBs, by first looking at one of the most important metrics for RBs: Opportunity Share (OS).
OS measures an RB’s share of the team’s RB Rush attempts and targets. OS is one of the more predictive metrics for RBs when it comes to fantasy output. I showed this in a preseason article discussing David Montgomery’s ADP, but it helps show the correlation. The following shows RBs who have finished with a 75%+ OS since 2012.
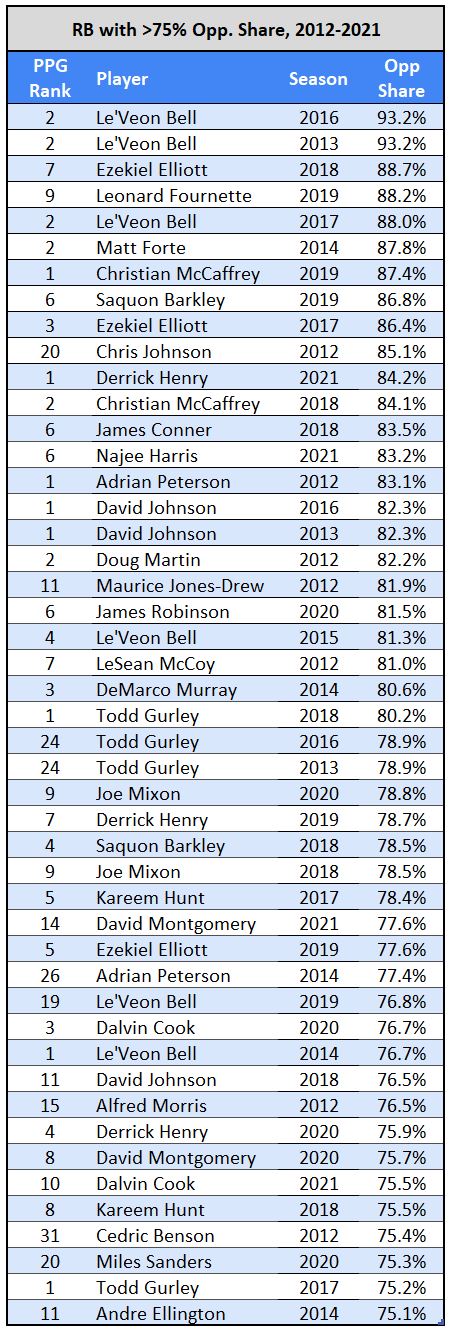
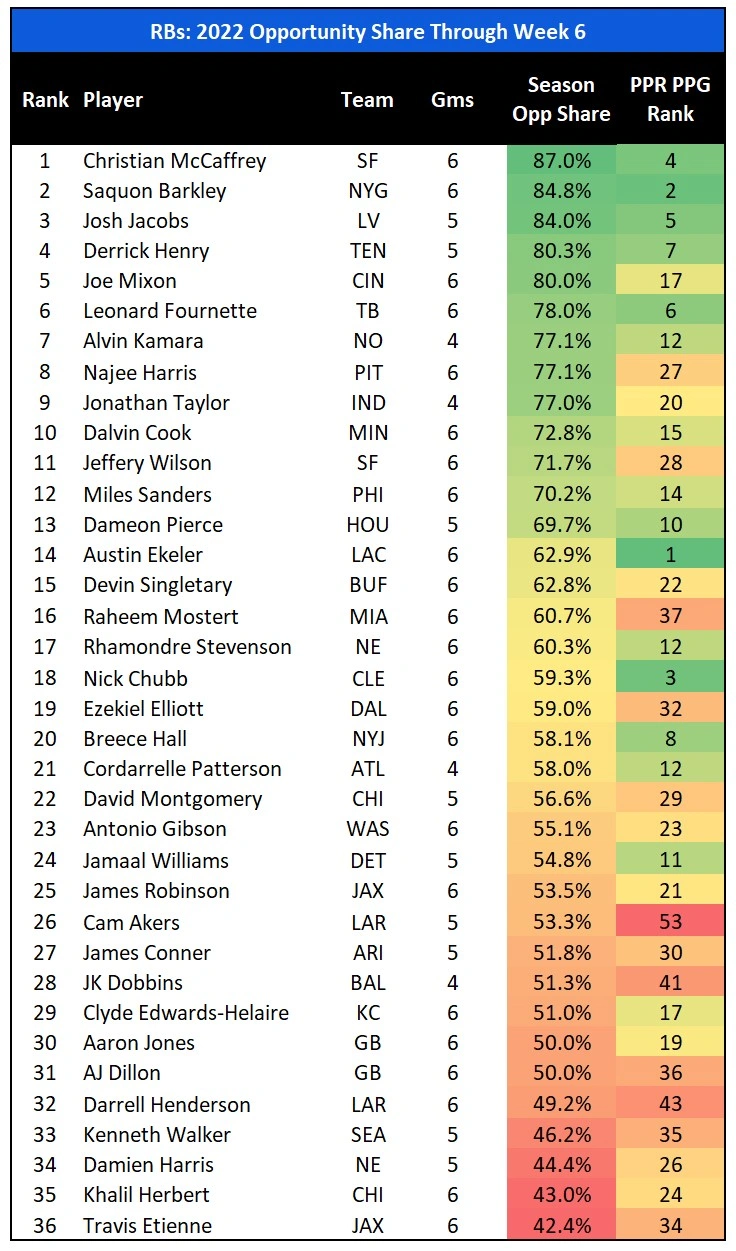
There have been 46 occurrences in that time frame. Thirty-six of 46 (78.3%) finished as a Top 12 RB in PPR points per game (PPG). Now, 75% is an excellent number to attain, and it makes sense that it has correlated to higher fantasy points output. Currently, there are nine RBs above the 75% mark. The following chart shows the Top 36 RBs in OS (minimum of three games played, Javonte Williams and Rashaad Penny are not included due to being out for the season).
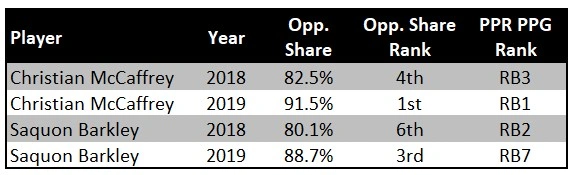
Seeing a healthy Christian McCaffrey and Saquon Barkley atop this list is not surprising. According to FantasyData’s advanced RB metrics, during the last two seasons in which McCaffrey and Barkley were both healthy, they put up the following numbers:
Six of the nine RBs above 75% are currently in the Top 12 (66.7%), which is slightly under the historical average but right in line with what we’ve seen. The most surprising name near the top of this list is Josh Jacobs, who before 2022 had not hit a 70% OS in the previous three seasons. I’ve been monitoring Jacobs as this uptick in opportunities began to stand out early in the season. I was curious if this career-high number would continue or was just a product of an early-season small sample size. But it seems Josh McDaniels coming to Las Vegas (along with Kenyan Drake being gone) has led to Jacobs being unleashed as a true bell cow RB, something Jacobs fans have been hoping for since he entered the league in 2019.
Now, season-long market share stats and fantasy PPG overall rank can only tell us so much. Yes, most of the players at the top of this list are also at the top of the fantasy PPG list. But we can’t all have a team full of season-long 75%+ OS RBs. There are multiple names lower in these season-long ranks who merit recognition based on which direction they are trending.
RB Opportunity Share Trends
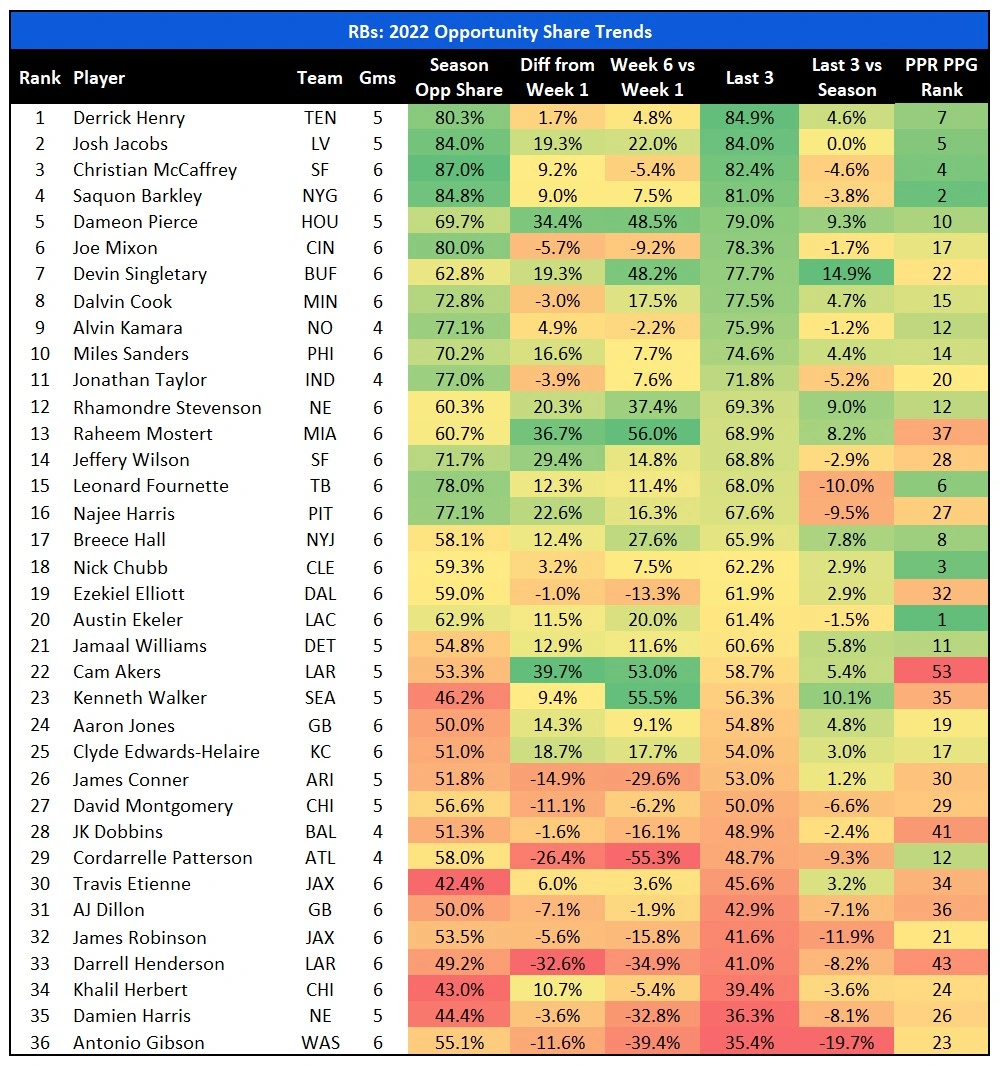
In addition to overall target share, the following group of charts includes:
- Difference between Week 1 OS (or first game played) and overall OS.
- Difference between Week 1 OS (or first game played) and Week 6 OS (or most recent game played)
- OS over the last three games (Last 3)
- Difference between the Last 3 and overall OS
Positive Trends
 Sign Up Today To Continue Reading…
The rest of this article is for FantasyData Subscribers only. Luckily for you, now is one of the best times of the year to subscribe. We are offering amazing deals on our Annual subscriptions. That means you get all our awesome DFS content, projections, rankings, and tools along with downloadable data for one full year. You will be set up for the rest of this NFL season and almost all of next year!
This chart is sorted by OS over each RB’s Last 3. Once again, six of the nine RBs above 75% over their last three are Top 12 fantasy RBs. You can also see some of the “studs stabilizing” I mentioned earlier with two players you would expect to be high on this list, Alvin Kamara and Dalvin Cook, in the Top 10 over the Last 3. Kamara is finally healthy and Cook led the NFL in Week 6 with a 93.3% OS.
Miles Sanders is a name I love seeing here. Sanders’ peripherals have always been solid, but the combination of injuries and questionable usage has kept him from consistent fantasy production. Although his OS dipped in Week 6, he’s one of the only RBs whose OS increased each week from Week 1 to Week 5. Sanders is a high-end RB2 with a 70.2% OS on the season, and just under the 75% mark (74.6%) over the Last 3.
Devin Singletary has seen his OS gradually increase as well, with the greatest increase in OS between his season long and Last 3 of the whole group (and a Last 3 above 75%). Unfortunately, it hasn’t translated to as much fantasy production with Singletary the RB22 through six weeks. This also indicates that rookie James Cook to becoming relevant this year may still be a ways off.
The players discussed thus far with positive OS trends were already their team’s RB1 when the 2022 season started. Rhamondre Stevenson has one of the higher deltas between season-long and Last 3, but his usage shot up once Dameon Harris suffered a hamstring injury in Week 5. I was in the camp predicting Stevenson would take over the lead role from Harris regardless, but the Harris injury provided an expedited spike in opportunity. From Week 4 to Week 5, Stevenson’s OS increased 33.1%, from 48.7% to 81.8%, one of the higher one-week increases this season. And Stevenson took full advantage, finished as the PPR RB14 in Week 5 and RB2 in Week 6. Harris is practicing this week and his return will cut into Stevenson’s usage, but I believe this backfield now belongs to him.
Another player I was wrong about (so far) is Texans’ rookie Dameon Pierce. With the third-highest positive delta between overall OS and Last 3, Pierce is an RB1, something I did not expect. I thought Rex Burkhead would see more of the RB market share. Since seeing 64.7% of the RB opportunities in Week 1, Burkhead’s high water mark was a 26.7% OS in Week 3.
A few other noteworthy players include Raheem Mostert and Breece Hall, who have both trended in the right direction organically, and Kenneth Walker, who is now the Seahawks’ lead back after the season-ending foot injury to Rashaad Penny. Walker had the second-highest OS of Week 6 at 92.3%.
Negative Trends
It feels like beating a dead horse to keep talking about the decline of Antonio Gibson, but he has seen the most drastic downward trend in OS. Gibson’s delta between his season-long and Last 3 OS is a league-high -19.7%. Meanwhile rookie Brian Robinson, since making his NFL debut in Week 5, has seen his OS start at 39.1% and increase to 51.5% in Week 6. Ron Rivera did say they have gone away from Gibson too much lately, and we’ll have to see if that’s just coach speak or if Gibson starts to climb back up the mountain.
Cam Akers is interesting within this data set. Largely due to an abysmal 13.6% OS in Week 1, Akers has shown an OS increase across these metrics, including 66.7% in Week 5. But Akers’ standing with the Rams is up in the air with trade rumors buzzing and him being a healthy scratch in Week 6. Akers also stands out as the lowest-ranked (by far) RB in this group at RB53.
Najee Harris’s numbers are also concerning. During his rookie season, Harris finished as the PPR RB8 (PPG). A relatively inefficient RB, averaging 3.9 YPC and a 38th-ranked fantasy points per opportunity (0.75), Harris did this on the back of massive volume, with a league-leading 86.4% OS. Harris’s season-long OS of 77.1% is solid, but he’s only at 67.6% over the Last 3, a -9.5% delta from that season-long number (4th-largest decrease). And this decrease in volume is playing out in his fantasy production, as he is currently the overall RB27 in PPR PPG.
The last player to discuss is James Robinson. Fellow Jaguars’ RB Travis Etienne does not stand out as a positive trend using these metrics, but Robinson does on the negative side. The following are Robinson’s weekly OS numbers in 2022:
- Week 1: 59.1%
- Week 2: 64.1%
- Week 3: 52.6%
- Week 4: 40.0%
- Week 5: 41.4%
- Week 6: 43.3%
Robinson is one of nine players in this group who has shown a negative trend across each metric. Etienne has not yet taken over this backfield, with an overall and Last 3 OS still below 50%, but there has been a slight positive increase (3.2%) and I think it’s only a matter of time before he is consistently seeing the majority of the Jaguars’ RB opportunities.
RB Fantasy Point Fluctuations
Due to the relatively strong correlation between OS and scoring RB fantasy points, I thought it would be helpful (and fun) to also look at the fluctuations and trends in RB fantasy production so far in 2022. According to JJ Zachariason (@LateRoundQB on Twitter) on his “Mailbag” podcast episode from October 21, 2022, overall RB fantasy scoring is lower than average compared to the last five seasons. Upper-echelon RBs are averaging fewer PPG this season and the lower-tier RBs are averaging slightly more PPG compared to the previous five years.
I bring this up because I and many others have noticed this trend, but JJ did the math to confirm. Some top-level fantasy RBs who got off to slow starts, causing some initial panic and overreaction, have been moving back toward expectations. The following chart shows the current PPR Top 36 RBs (PPG). Rashaad Penny and Javonte Williams have been omitted, and this is based on a minimum of three games played (so no Brian Robinson or Latavius Murray). This does not include Week 7 Thursday Night Football. For each RB, the data includes:
- Weekly PPR RB rank
- Average weekly PPR RB rank (season-long)
- Average weekly PPR RB rank (last three games)
- Percentage of weeks as:
- RB1 (RB1-RB12)
- RB2 (RB13-RB24)
- RB3 (RB25-RB36)
- RB4+ (RB37+)
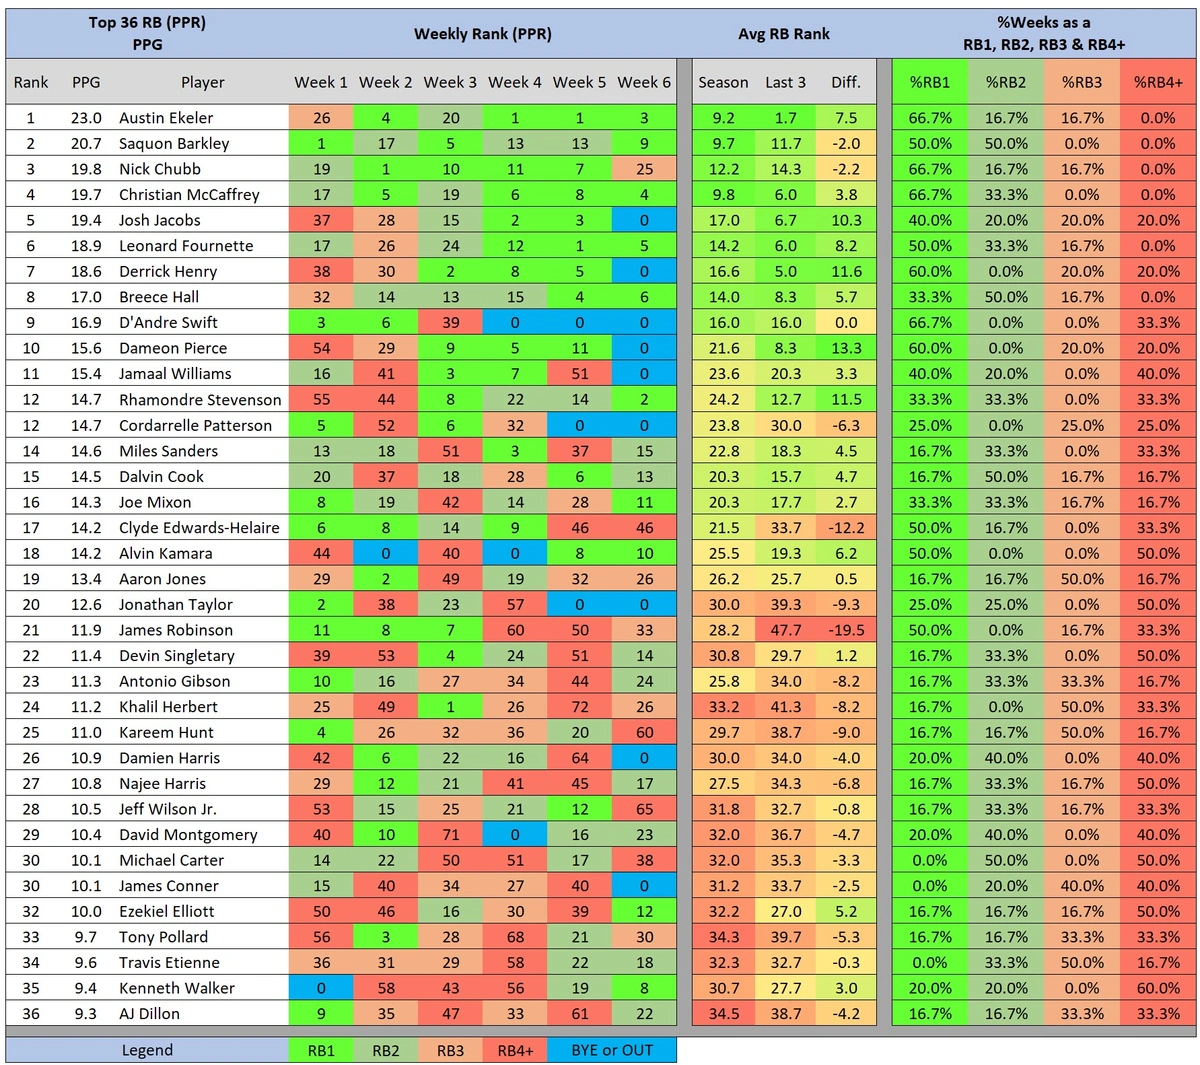
You see familiar and unsurprising names at the top, and it mirrors the OS leaderboard in many cases. The purpose of this data is to look further than just the overall PPG rank and to attain a better visualization of consistency and inconsistency. Eight of the Top 10 RBs have finished as an RB1 in at least half of the weeks they’ve played. Two RBs (Austin Ekeler and Christian McCaffrey) have yet to finish outside the Top 24. Again, not surprising. The RBs who score the most fantasy points typically do it consistently. For me, it is helpful to be able to see visually just how consistent some have been. It is easy to become hyper-focused on the current week wherein you may miss out on some of the useful trends a slightly bigger picture is showing.
I have mentioned multiple times in this article top-shelf RBs who started slowly. You can see that here. Josh Jacobs, Leonard Fournette, Derrick Henry, Breece Hall, Dameon Pierce, and Alvin Kamara all started out outside the Top 24 at least one of the first two weeks. Jacobs, Fournette, and Hall did not have an RB1 finish until Week 4. This drives home the point that you need to be patient with talented RBs in good situations or with an expected path to higher volume.
If we sort by average PPG rank over the last three games, this stands out even more.
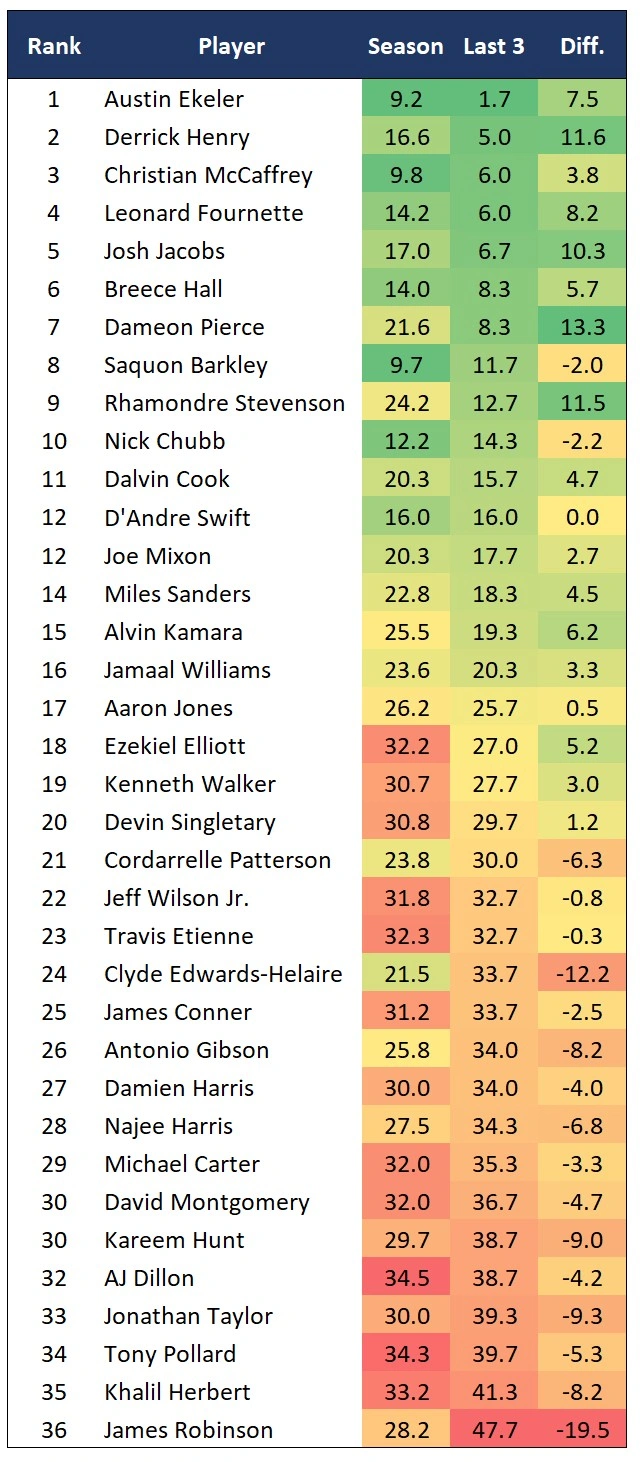
You do not see significant movement up or down this list of players, but you see a significant improvement in the average ranks themselves. Season-long, there are only three RBs whose average weekly rank is 12 or better. Looking at the last three games, there are eight RBs whose average is 12 or better. We covered some of the reasons for jumps in opportunity for individual players in the discussion about OS, and it is the same here. In certain situations, talent is winning out like with Breece Hall and Dameon Pierce. In other situations, injuries have paved the way for talented RBs to break out, like with Rhamondre Stevenson and Kenneth Walker. Alvin Kamara is finally healthy and has put up two straight RB1 weeks (not including Week 7 TNF). The initial panic about Derrick Henry has been squashed by him having the second-highest average rank over the last three weeks.
And just like the flip side with OS, we see it translate with fantasy points too. Here is the same data sorted by the difference between season-long average weekly PPG rank and that average over the last three games:
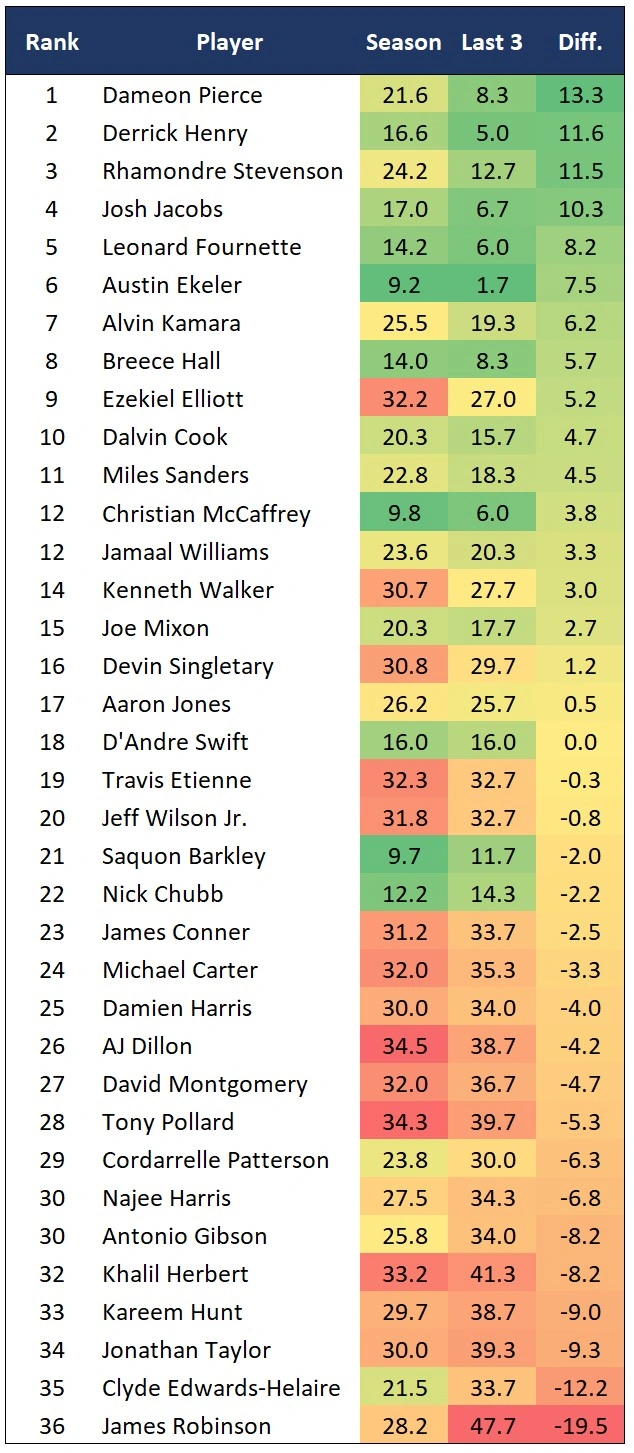
James Robinson has had the most significant decrease in average weekly PPG rank. After starting the first three weeks as the RB11, RB8, and RB7, he has finished the last three weeks as the RB60, RB50, and RB33. Now, at least Robinson’s rank has increased from that abysmal RB60 in Week 4, but Travis Etienne, while not yet smashing into the Top 12, has finished as a Top 24 RB the last two weeks. Clyde Edwards-Helaire has also seen a drastic fall in average weekly RB rank. With an average rank of RB9.3 through four weeks, Edwards-Helaire has finished as the RB46 each of the last two weeks.
I realize that just looking at the rank number and average rank number might not seem as helpful as the actual fantasy points scored, but the purpose here is to show the trends. Yes, there is an amount of fantasy points attached to each one of the weekly rank numbers on this chart, but I think it is more effective in discussing trends to show the actual rank numbers that comprise Top 12, Top 24, Top 36, etc. because it is something everyone is familiar with and is more recognizable than raw fantasy points scored.
Thanks for reading! If you have any questions about the data used in this article or about fantasy football in general, feel free to hit me up on Twitter.