Fantasy Football Beneath the Surface: Week 8 Breakdown
Another week of NFL football, another pile of data to sift through looking for clues. Clues as to what leads to certain results and clues for speculating what might be coming next. They say, “looks can be deceiving.” The same can be said for surface-level statistics in fantasy football. In this weekly article series, I will be looking beneath the statistical surface, beyond the standard box score, using the premium statistics provided by FantasyData, including advanced and efficiency metrics across the fantasy skill positions, to search for puzzle pieces that fit together. The data charts used in this article do not include data from the Week 8 Thursday Night Football game between the Buccaneers and Ravens.
Team Data Trends
We now race headlong into Week 8 of the 2022 NFL Season. Up until now in this article series, I have looked at advanced and peripheral statistics across skill position groups as the 2022 season has progressed, focusing on positive and negative trends for individual players (mostly market share statistics). In this article, I will be looking at some team-level statistical trends, including market share distribution and team pass-run ratio.
For the charts in this article, the column by which the data and team rankings are sorted will have a yellow-highlighted column title.
Enough of the 2022 season has happened that it now becomes important to look beyond season-long statistics. Season-long numbers, for both teams and individual players, should not be ignored, but focusing on the recent trends provides a more accurate and representative picture of what is happening now and what might be expected in both the short- and long-term of the 2022 season. I will be showing some season-long team statistics and how they compare to the same numbers over the last three games.
Team Market Share and Play-Calling
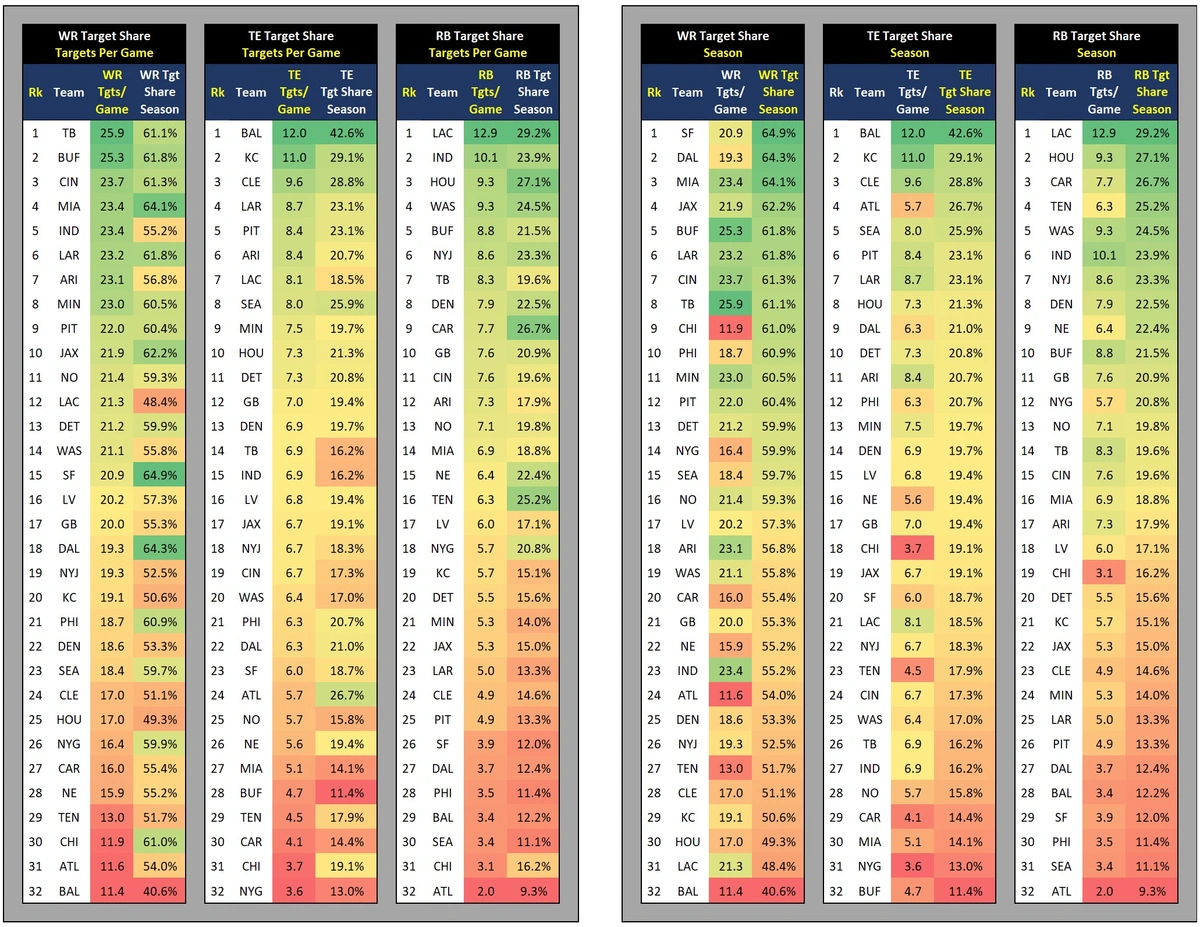
The following chart shows each team’s season-long target distribution to the different fantasy-relevant pass-catchers (WR, TE, and RB), as well as each team’s targets per game for each pass-catching position for context. For the following charts, the chart on the right is sorted by target share. The chart on the left is sorted by targets per game.
This is a continuation of team target distribution data I have shared previously, but the added context of targets per game confirms the point I have been making about market share numbers, by themselves, being misleading. The low passing volume for the Bears and Falcons has been discussed at length all season long. This is why each team’s target distribution numbers do not tell the whole story. Looking at the chart on the right, the Bears have the 9th highest WR target share at 61.0%. However, that red-shaded WR targets per game of 11.9 distinctly stands out (3rd lowest). It is in this type of data where the color schemes of conditional formatting can add a visualization to simply stating “the Bears don’t pass very much.” It is the same with the Falcons’ TE target share. Seeing the Falcons with the 4th highest TE target share feels like a slap in the face to those of us who have invested heavily in Kyle Pitts. But with only 5.7 TE targets per game (season-long, 9th lowest), that target share does not equate to TE fantasy production.
Many of the teams at or near the tops of each chart are not surprising. With data like this, the first indication is the amount of green shading. The Ravens have the highest TE targets per game and the highest TE target share on the season (by a wide margin). Mark Andrews is a top fantasy TE due to his talent combined with this volume, and this was shown even more in Week 8 Thursday Night Football (TNF). With Andrews playing at less than 100%, rookie TE Isaiah Likely caught six of seven targets for 77 yards and a TD and saw 20.6% of Baltimore’s targets on the night. The Chargers have the highest RB targets per game and the highest RB target share. Austin Ekeler sits atop the fantasy RB mountain in points per reception (PPR) formats largely due to being on pace for 148 targets one the season, which would be seven more than the current single-season RB target record-holder (Christian McCaffrey; 141 targets in 2019). This data shows that these fantasy titans are likely to remain as such based on their team’s target distribution.
There are a few other teams worth pointing out here. The 49ers and Cowboys are first and second in season-long WR target share but are both middle-of-the-pack in WR targets per game. On the flip side, the Colts are 5th in WR targets per game but 23rd in WR target share. This discrepancy is less common than the “high target share, low targets per game” scenario, and is only possible with a high passing volume. You also see this discrepancy with the Chargers and Cardinals, who, along with the Colts, are Top 5 in pass attempts per game. This discrepancy is also the more fantasy-friendly of the two, as you would much rather put a Colt, Cardinal, or Charger WR in your fantasy lineup than a WR from the Bears or Falcons.
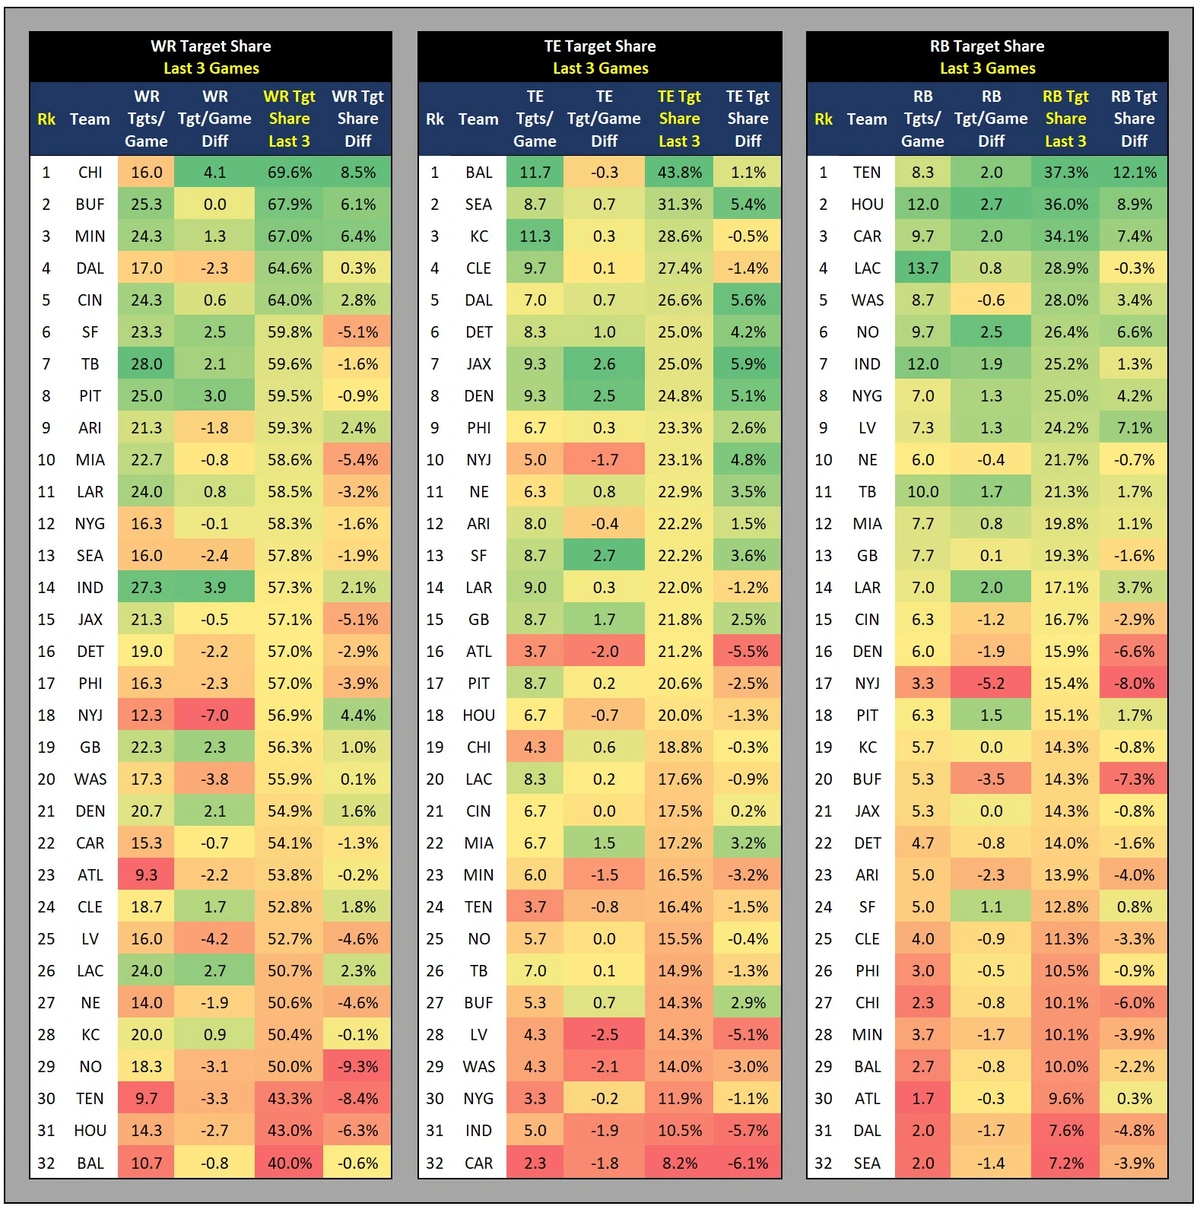
Now for the trends. The following chart shows the same data points (targets/game and target share) but over the last three games. This chart is sorted by target share to the three pass-catching positions over each team’s last three games. I have also added the difference between each team’s season-long numbers and the last three games for both targets per game and targets share.
This is where things get more interesting and helpful than the season-long data. Take the Bears for instance. Yes, they are still averaging a low pass volume. But, over the last three games, they have the highest WR target share at 69.6% and they have the highest increase in WR targets per game at 4.1. We have covered that the Bears market from which the pass catchers are sharing has not been at a “fantasy-lucrative” level. But it is trending upward and no longer the laughingstock it was. This makes sense with a new coaching staff and with Justin Fields still acclimating to the NFL and the Bears’ offense. Those who did not prematurely give up on players like Fields and Darnell Mooney may be rewarded if this upward trend continues.
Tennessee Titans
The Titans have had the highest increase in RB target share (12.1%) when looking at each team’s last three games. They also have the 4th highest season-long RB target share (25.2%) and the highest over the last three games (37.3%). But there are a couple of factors causing this increase that makes the increase less promising than it seems. On the season, Ryan Tannehill is averaging 24.3 pass attempts per game, which is the third lowest average, ahead of only the Falcons and Bears. The Titans low passing numbers have been overshadowed by the ludicrous sub-40% pass rate for both the Falcons and Bears. This is partly due to it matching the expectations for the Titans’ offense coming into the season. But since becoming a Titan in 2019, Tannehill has averaged 28.8 pass attempts per game, so he’s over four passes per game below that, and it’s been even lower over the last three games (22.0 pass attempts per game). The passing market that this RB target share is attached to is well below the league average.
This isn’t to say there is no fantasy value here, it’s just not Chargers-level RB receiving opportunity. Derrick Henry currently sits at an overall target share of 11.8%, the 13th-highest RB target share in the league according to FantasyData advanced data. This fact has also flown under the radar, especially compared to Henry’s receiving involvement over the last four seasons:
Derrick Henry target shares:
- 2018: 4.3% (51st)
- 2019: 5.7% (43rd)
- 2020: 6.7% (32nd)
- 2021: 3.8% (52nd)
Henry has averaged four targets per game over his last four games with two games at five or more targets. Even Dontrelle Hilliard has been fantasy-relevant for a few games this season, although that has been TD dependent.
Ezekiel Elliott
You can see the cap on Ezekiel Elliot’s historical ceiling in plain sight in this data. From 2018-2021, Elliott averaged 75.5 targets per season.
- 2018: 6.3 targets per game, 18.4% target share (5th)
- 2019: 4.4 targets per game, 12.3% target share (13th)
- 2020: 4.7 targets per game, 11.6% target share (8th)
- 2021: 3.8 targets per game, 10.2% target share (13th)
- 2022: 1.1 targets per game, 3.9% target share (50th)
Elliott only has eight targets in seven games. You can see that Elliott has been on the decline in targets per game and target share over the last four seasons, but the significance of the drop between 2021 and 2022 (so far) is concerning for his fantasy value. The Cowboys have the 6th lowest season-long RB target share (12.4%) and their 7.6% RB target share over the last three games is ahead of only the Seahawks in that time.
New York Jets
The Jets have the greatest negative difference between season-long and “last three games” RB target share. While somewhat lazy, there is a clear reason for this decline. The Jets averaged 50 pass attempts per game and put up the following numbers from Week 1 to Week 3 with Joe Flacco at QB:
- Week 1: 59 pass attempts, 18 RB targets, 31.6% RB target share
- Week 2: 44 pass attempts, 9 RB targets, 20.9% RB target share
- Week 3: 52 pass attempts, 13 RB targets, 27.1% RB target share
Since Zach Wilson came back from injury, the Jets have averaged 25.3 pass attempts per game, and the statistics listed above have declined. Week 4 through Week 7:
- Week 4: 36 pass attempts, 9 RB targets, 27.3% RB target share
- Week 5: 21 pass attempts, 4 RB targets, 19.1% RB target share
- Week 6: 18 pass attempts, 3 RB targets, 17.7% RB target share
- Week 7: 26 pass attempts, 3 RB targets, 13.0% RB target share
The problem? The Jets currently have a four-game winning streak. While these passing numbers are not ideal for fantasy purposes, the Jets keep winning. It is the same with the Falcons. A collective groan from the fantasy community can likely be heard from space when the Falcons continue to not pass the ball to Drake London or Kyle Pitts, but the Falcons have also been winning (kind of). Breece Hall’s brutal season-ending injury may force the Jets to rely more on the pass, but I think it is more of a Zach Wilson and his limitations problem than an offensive concept problem.
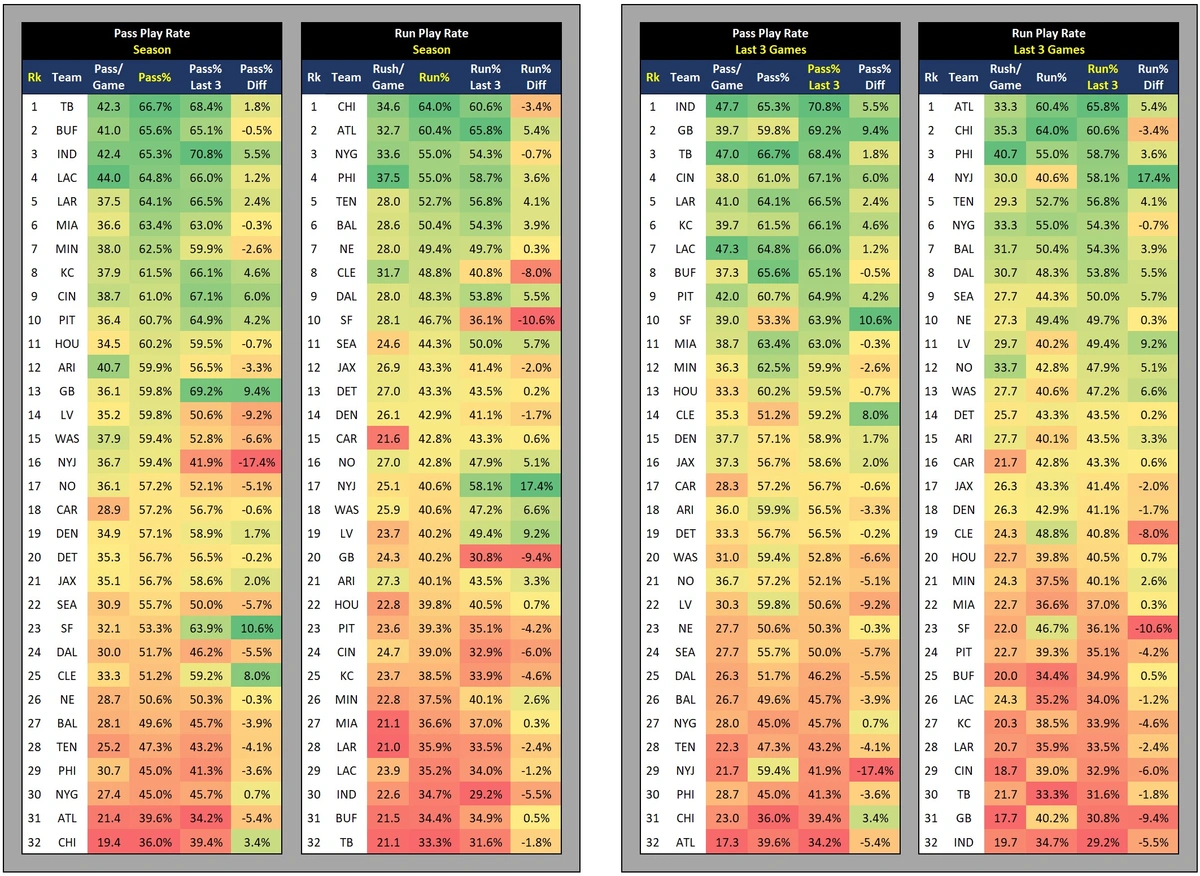
The last chart I want to show you in this article is connected to passing market share trends. The following shows each team’s pass-run ratios, both season-long (chart on the left) and over each team’s last three games (chart on the right). I also included passes per game and rush attempts per game for context.
Las Vegas Raiders
One of my favorite trends from this entire data set involves the Las Vegas Raiders. Season-long, the Raiders have the 14th highest pass rate at 59.8%, but over the last three games, that rate has declined by 9.2% to 50.6%, putting them at an 11th highest 49.4% run rate in that same time. Why do I like this? Wouldn’t that mean less passing volume for Davante Adams? Yes, but looking back up to the target share charts, the Raiders also have the 9th highest RB target share over the last three games, representing the 4th highest increase compared to the season-long number. This does nothing for Amon-Ra St. Brown, but it is why Josh Jacobs has a path to the overall RB1 this season if the trend continues.
Peripheral data showing how the Raiders have unleashed Josh Jacobs
Season
Pass-run ratio: 59.8%-40.2%
RB Target Share: 17.1%Last 3
Pass-run: 50.6%-49.4% (9.2% swing👀)
RB TS: 24.2% (+7.1%👀)More rushing & more passing to RB w/ Jacobs seeing 84.8% of the RB opportunities pic.twitter.com/AgstXlROsH
— Scott Rinear (@MunderDifflinFF) October 27, 2022
You can also see additional data regarding the Jets’ decreasing passing volume trend (again, first look for red and green shading that stand out). The Green Bay Packers are an offensive mess, and those of us who were high on A.J. Dillon now have him riding the bench where we can. The Packers’ decrease in run rate over their last three games (compared to season-long) is only surpassed by the San Francisco 49ers. But over their last three games, their run rate has dropped to 30.8%, the second lowest, ahead of only the Colts in that time frame. This has been disastrous for Dillon’s and, to a lesser extent, Aaron Jones’ fantasy production. For a team with a well known lack of pass-catching weapons this season, this trend is not what one would expect, especially with an offensive line ranked 5th coming into the 2022 season and currently ranked 4th by PFF.
Thanks for reading! If you have any questions about the data used in this article or about fantasy football in general, feel free to hit me up on Twitter.
Quick Links


