Beneath the Surface: Week 9
Another week of NFL football, another pile of data to sift through looking for clues. Clues as to what leads to certain results and clues for speculating what might be coming next. They say, “looks can be deceiving.” The same can be said for surface-level statistics in fantasy football. In this weekly article series, I will be looking beneath the statistical surface, beyond the standard box score, using the premium statistics provided by FantasyData, including advanced and efficiency metrics across the fantasy skill positions, to search for puzzle pieces that fit together.
QB Advanced and Efficiency Data
Week 9 is already here. Writing this article series every week drives home how fast the NFL season flies by. Week 8 saw a barrage of fantasy points and likely season-high fantasy scores in your leagues. I ended up on both ends of the scoring spectrum across my 13 leagues. Running backs Tony Pollard, D’Onta Foreman, and Alvin Kamara put up 30+ fantasy points (depending on the scoring settings). Massive games like these players had, as well as WR AJ Brown, are what we live for in fantasy football. There are not many better feelings than watching your starting RB or WR (or both) explode. I have spent the majority of this article series doing deep statistical dives on RBs and WRs. I felt it was time to switch gears slightly and do the same with QBs.
In this article, I will be looking at a variety of statistics for the current Top 36 QBs according to FantasyData (fantasy points per game (PPG) basis). When I began organizing this QB data I didn’t realize the spreadsheet would grow to a size that would be virtually unreadable in an article format. So I have broken the data out into different categories. Each chart/category and the metrics within it will be described, followed by takeaways and analysis of some of the positives and negatives the data indicates for different QBs.
Typically I would have a minimum-games played threshold for inclusion on a fantasy points per game leaderboard, but I am including Taylor Heinicke (two games played) and Dak Prescott (three games played) because they are currently the starting QBs for their respective teams. Both present a small sample size but there are still helpful takeaways from this data set.
The data used for this article is from the following sources:
- FantasyData Advanced/Efficiency QB Data
- PlayerProfiler
- Weekly Database by David Wright (@ff_spaceman on Twitter)
For the charts in this article, the column by which the data is sorted will have a yellow-highlighted column title.
General QB Statistics
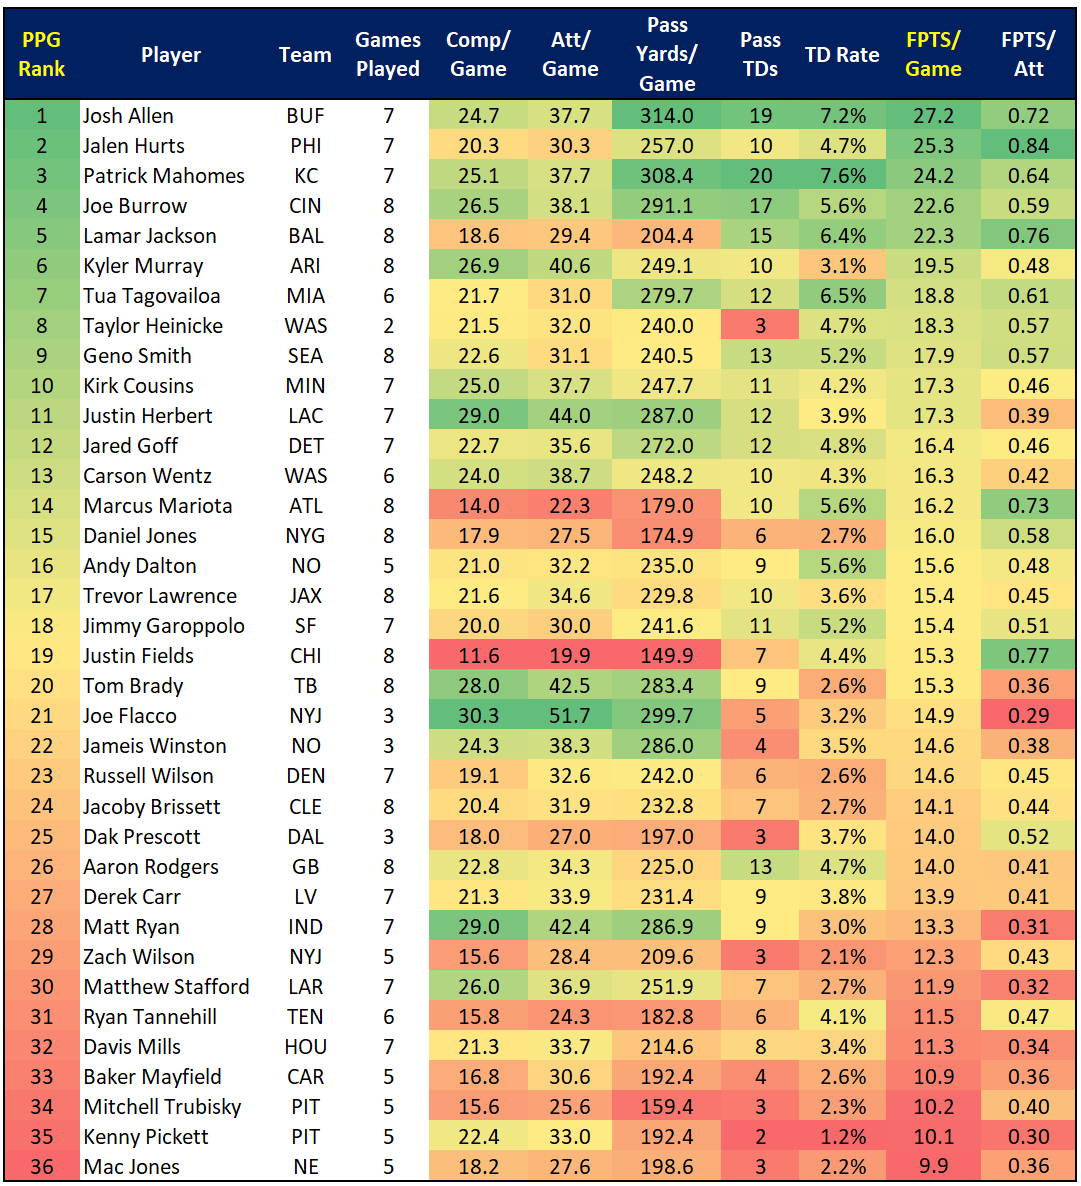
I’ll start with some basic statistics, sorted by fantasy points per game.
The following chart includes the following general statistics:
- Completions per game
- Pass attempts per game
- Passing yards per game
- Passing TDs
- TD rate
- Fantasy points (FPTS) per game (Chart is sorted by this)
- FPTS per pass attempt
Familiar names reside at the top of the QB fantasy mountain in 2022. Josh Allen is nothing if not consistent, currently the QB1 after finishing as the QB1 in 2021 and the QB2 in 2020 (PPG, he was QB1 in total points). Allen and Patrick Mahomes are the only QBs averaging 300+ passing yards per game and are also the only two QBs above a 7% TD rate (passing TDs divided by pass attempts).
Looking at the Top 5 QBs in FPTS per pass attempt, you’ll notice a common thread. Starting with the highest, the Top 5 includes:
- Jalen Hurts
- Justin Fields
- Lamar Jackson
- Marcus Mariota
- Josh Allen
Fields and Mariota provide a big hint, as they are both in the literal red in completions, attempts, and passing yards per game. Yes, with pass attempts being the denominator in the FPTS per attempt equation, fewer pass attempts will drive up the number, similar to RB FPTS per touch leaders who are often low rush attempt, high reception players. But it’s more than that. All five QBs are also Top 10 in rushing yards per game. The high FPTS floor provided by rushing is apparent across a variety of metrics and is how Fields has finished as a Top 12 fantasy QB for four consecutive weeks while still averaging under 20 pass attempts per game on the season.
On the other end of the FPTS per pass attempt spectrum, the low rates by Tom Brady and Justin Herbert are concerning. They are both high pass attempt QBs, so they will likely never top a list like this. But compared to their previous seasons, their FPTS on a per pass attempt basis are down.
In 2020 and 2021, Brady’s FPTS/attempt was 0.55 and 0.52. In the same time frame, Herbert put up 0.56 and 0.57. In 2022, Brady is at 0.36 and Herbert is at 0.38, the two lowest rates among the Top 20 fantasy QBs. I’m worried about Brady. I have him on a few teams and he is approaching my bench. I’m higher on the rest of season outlook for Herbert. Injuries to his pass catchers have been a major factor, as is the rib injury he suffered earlier in the season. But he’s getting farther away from the injury and the Chargers have one of the more fantasy-friendly rest of season (ROS) schedules for both QBs (best ROS schedule) and WRs (7th best ROS schedule).
QB Efficiency Statistics
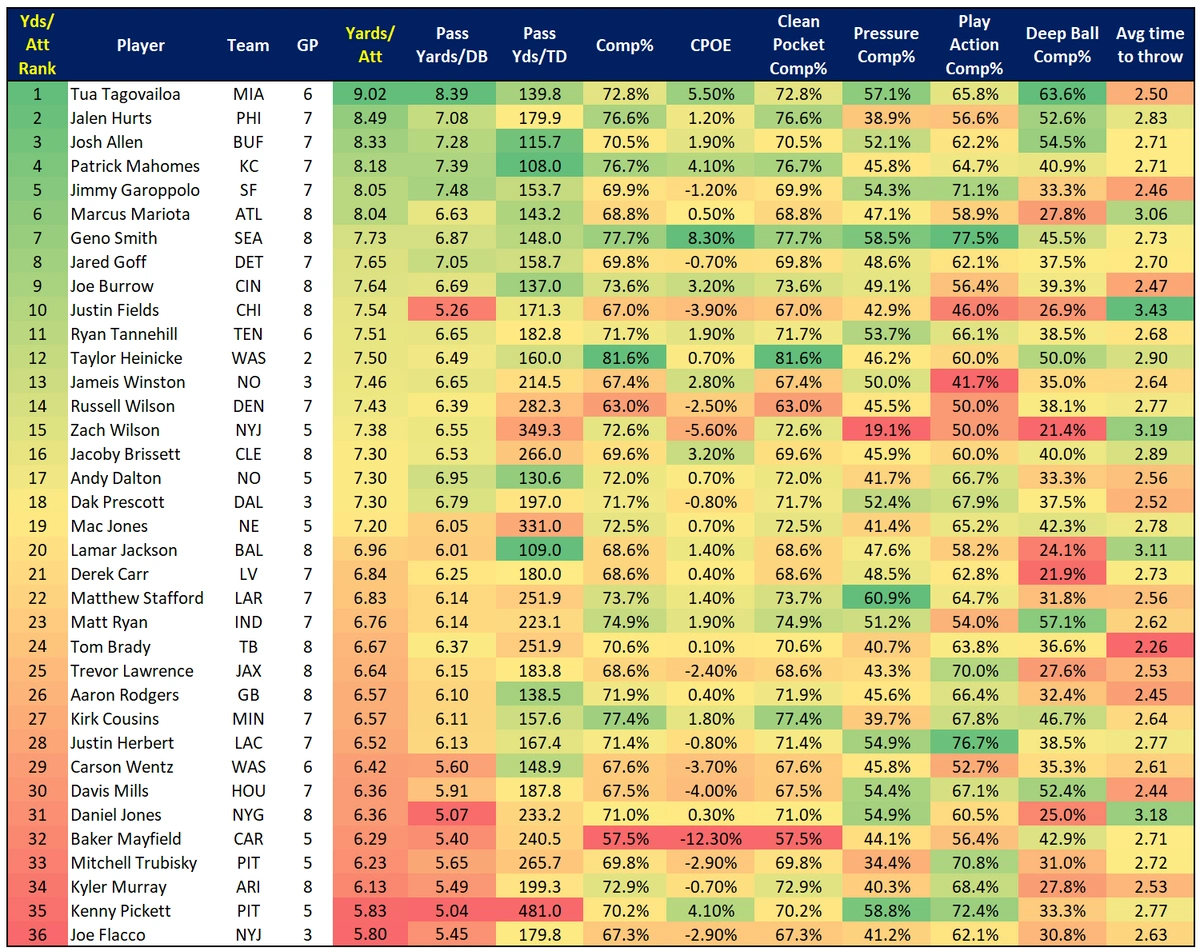
The following chart includes the following efficiency statistics:
- Passing yards per attempt (Chart is sorted by this) (Yards/Att)
- Passing yards per drop back (Pass Yards/DB)
- Passing yards per passing TD (Pass Yds/TD)
- Completion percentage (Comp%)
- Completion percentage over expected (CPOE)
- Completion percentage in a clean pocket (Clean Pocket Comp %)
- Completion percentage when pressured (Pressure Comp%)
- Completion percentage on play-action (Play Action Comp%)
- Completion percentage on deep pass attempts (20+ yards) (Deep Ball Comp%)
- Average time to throw
Efficiency metrics are where Tua Tagovailoa and Geno Smith flex their muscles. Tua leads the entire group in yards per pass attempt and yards per drop back. Also, although a common knock on Tua is his arm strength and ability to throw the deep ball, he leads the league in deep ball completion percentage (20+ yard passes).
With Geno Smith, other than Heinicke in only two games, Smith leads in both completion percentage (77.4%) and CPOE (+8.3%). CPOE means that Smith’s “Expected” completion percentage, based on a variety of factors (e.g.: depth of target, down and distance, field position, home or away, and pass location to name a few) is 8.3% lower than his actual rate. Qualitatively, most would agree Smith is exceeding expectations this season. CPOE is one metric showing this quantitatively. I could spend an entire article discussing CPOE, a metric growing fast in popularity. Instead, I’ll point you to this article by The 33rd Team if you want a thorough explanation of this metric.
Smith has also been efficient in completing passes across the typical passing conditions faced by QBs. Smith has the highest clean pocket completion rate (77.7%), again, other than Heinicke, has the third highest rate when pressured, and the highest completion rate on play-action.
Surprisingly, Fields has been given the most time to throw on average, followed by Zach Wilson. When looking at his efficiency numbers, the fact that Zach Wilson has seen the second-longest average time to throw is a major red flag. Other than Baker Mayfield, whose dark red numbers on this chart show why he lost his job, Zach Wilson’s CPOE is the lowest in the league. Wilson’s overall completion percentage is 5.6% lower than expected. He is 11th in clean pocket completion rate, a league-low in completion rate when pressured (19.1%) and on deep balls (21.4%), and third lowest play-action rate (50.0%). All of this while trailing only Fields in the amount of time he is given to throw per play. Zach Wilson should not be starting QB in the NFL right now.
Matthew Stafford had had a down year, currently only the QB30 in PPG. But he does lead the NFL in completion rate when pressured. It’s expected that the players farther down the fantasy QB pecking order are mostly yellow and red across these metrics, and you see that with another veteran who is struggling. Regardless of the reasons, this is apparent with Aaron Rodgers. QB26 is uncharted territory for Rodgers, and his FPTS per attempt are also significantly down. After 0.73 in 2020 and 0.63 in 2021, Rodgers is all the way down to 0.41 in 2022. He, like Brady, is a no-brainer starter of seasons past who is hitting fantasy benches, if not waiver wires.
QB Turnover Statistics
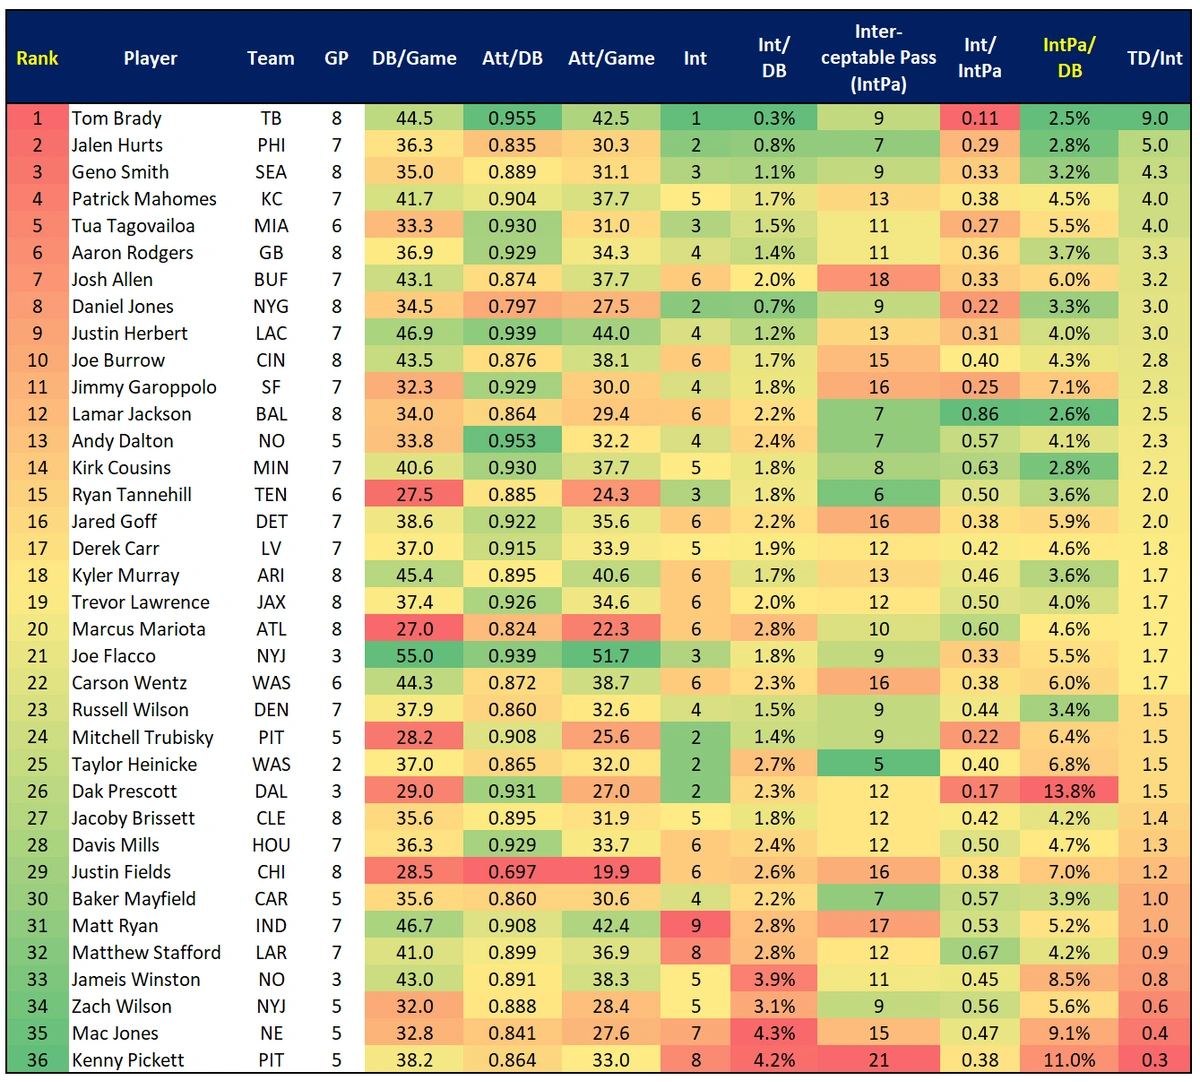
The following chart includes the following turnover statistics:
- Drop backs per game (DB/Game)
- Pass attempts per drop back (Att/DB)
- Interceptions (Int)
- Int per drop back (Int/DB)
- Intercepatable passes (IntPa)
- Interceptions per IntPa (Int/IntPa)
- IntPa per drop back (IntPa/DB) (Chart is sorted by this)
- Passing TDs per Int (TD/Int)
With turnover statistics, it is important to take into account passing volume and look at per-game numbers. For instance, Josh Allen has the second most interceptable pass attempts (18), a statistic that is available at FantasyData’s Advanced QB Data. But you can see Allen has only the 10th highest interceptable passes per drop back (IntPa/DB). This is due to Allen being Top 10 in drop backs per game. Allen is tied for 4th with six interceptions on the season but he more than makes up for this in fantasy with his 70%+ completion rate and rushing numbers and has an impressive TD-interception ratio of 3.2 (7th best).
Tom Brady is interesting in this data set. Brady leads the group with only one interception on the season, a 9.0 TD-interception ratio, and throwing an interceptable pass on only 2.5% of his pass attempts. However, if you look at the rate at which his interceptable passes have been intercepted (Int/IntPa) you see he has the lowest rate at 0.11. This means only 11% of Brady’s interceptable passes have actually been picked off, the lowest rate in the league. So, while Brady has been his usual low-turnover self, there has been some good fortune involved in that.
Dak Prescott also stands out within this data set. Prescott did miss a chunk of games due to injury, so his three-game sample size is small. But as I stated earlier, there are still useful takeaways from his turnover numbers. Prescott has thrown only two interceptions in three games played. However, he has thrown 12 interceptable passes. Prescott is 23rd in TD-interception ratio and has the highest (by far) rate of interceptable passes per drop back. Add to this Prescott’s second lowest interceptions per interceptable passes rate (0.17) and these numbers could easily be worse. Only three games played is not enough to push any panic buttons, but this is something I’ll be monitoring with Prescott moving forward.
Kenny Pickett is a turnover machine. Not surprising for a rookie QB who has somewhat been thrown to the proverbial wolves, but it is worth noting. Pickett has played five games and has the following turnover statistics:
- Eight interceptions (2nd most behind only Matt Ryan)
- Interception per drop back rate of 4.2% (2nd highest behind only Mac Jones)
- Twenty-one Interceptable passes (most)
- TD-Int ratio of 0.3 (lowest)
- Interceptable passes per drop back rate of 11.0% (2nd most after Prescott)
My metaphorical jury is still out on Pickett’s fantasy future, but for now, start your DSTs against the Steelers.
QB Advanced Statistics
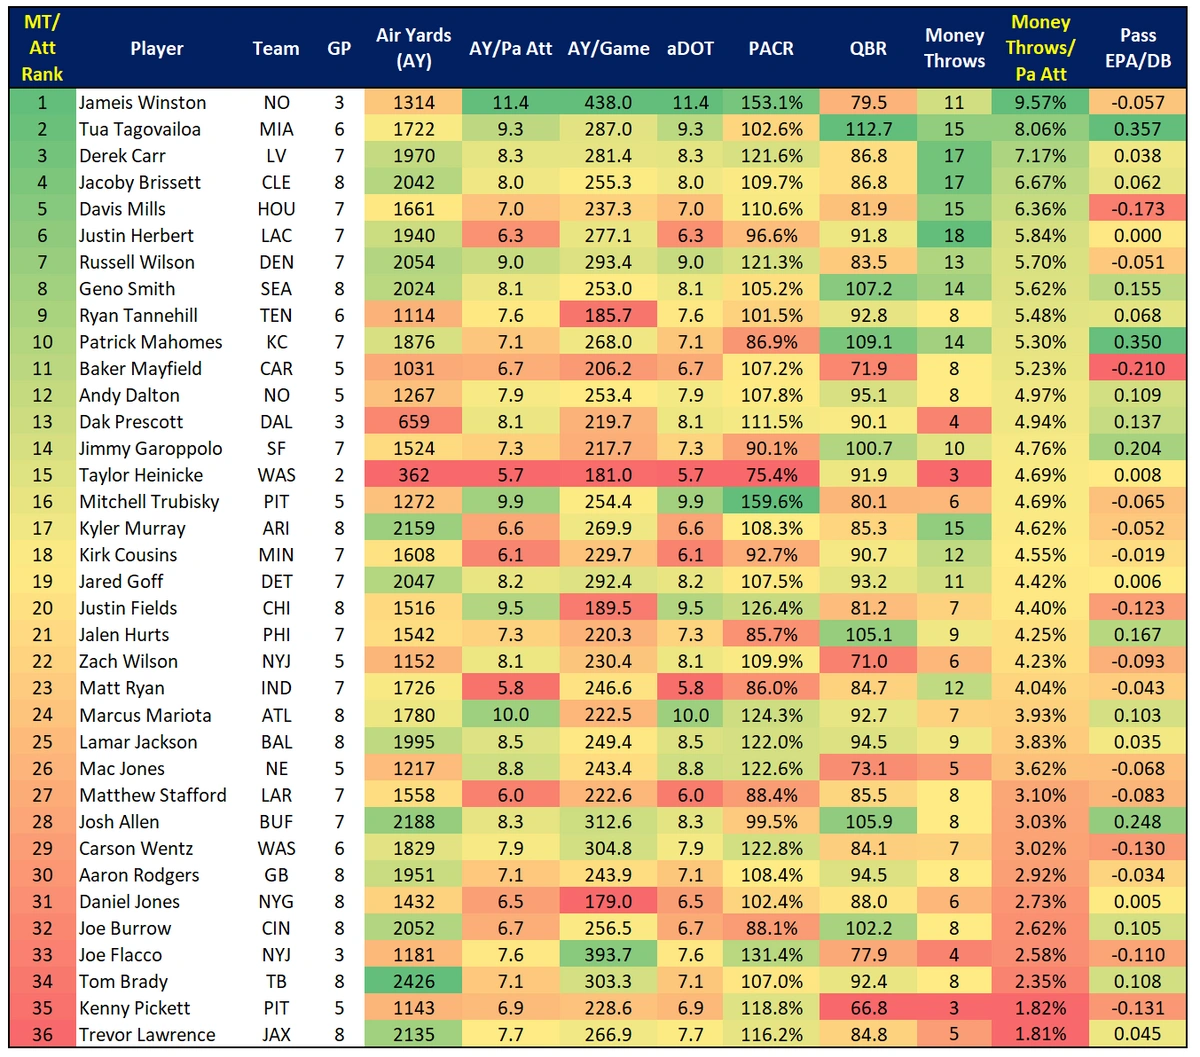
The following chart includes the following advanced statistics:
- Air Yards (AY)
- AY per pass attempt (AY/Pa Att)
- AY per game (AY/Game)
- Average depth of target (aDOT)
- Passing Air Conversion Ratio (PACR)
- QB Rating (QBR)
- Money Throws (defined by FantasyData as “A pass requiring exceptional skill or athleticism as well as critical throws executed in clutch moments”)
- Money Throws per pass attempt (Chart is sorted by this)
- Expected Points Added (EPA) per drop back (Pass EPA/DB)
I’ll start by explaining the Passing Air Conversion Ratio (PACR) metric and what it is showing us. This statistic measures the number of air yards per passing yard. Air yards are the yardage distance a pass travels to its intended target (line of scrimmage to the target location). Passing yards includes this distance plus the yards the pass catcher gains after the catch, beyond the target location. So, what PACR is telling us is the level at which a QB’s passing yards are reliant upon yards after the catch (YAC) by the pass catcher. It is important to note that air yards are tied to targets, not receptions, which is why a PACR is often above 100% (more intended air yards than completed passing yards). Unlike most metrics, PACR numbers aren’t inherently “good” or “bad”. Rather, it indicates a team’s effectiveness with yards after the catch.
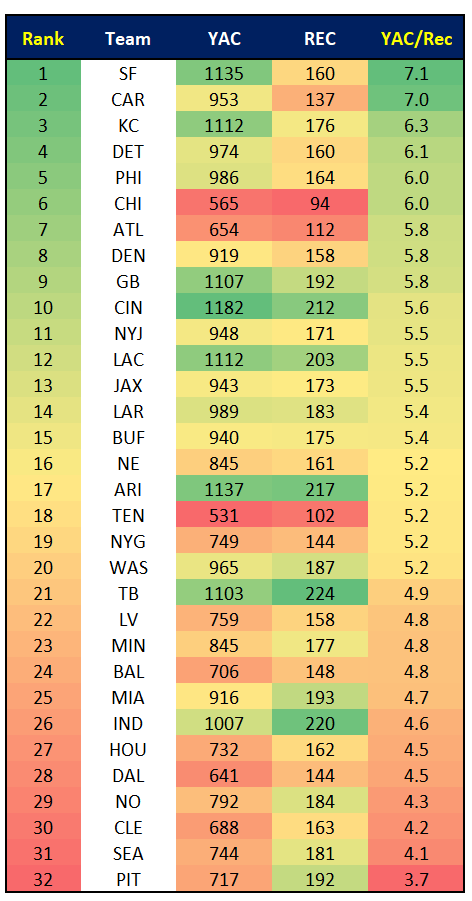
This is why a QB like Jimmy Garoppolo has the seventh-lowest PACR (90.1%). The following chart shows yards after the catch, receptions, and YAC per reception at the team level. You can see the 49ers lead the league in team YAC at 7.1. Whereas it also makes sense that the combination of the Steelers’ QBs who have played this season have a combined PACR well above 100%, as the Steelers have a league-low 3.7 yards after the catch per reception.
Another metric shown here is “Money Throws” (also available in FantasyData’s Advanced QB data). You can see the definition in the bullet list above, but this is a “beyond the box score” statistic where every pass or completion is not created equally. For instance, this dime by Geno Smith against the Saints would be considered a “Money Throw.”
— Scott Rinear (@MunderDifflinFF) October 30, 2022
Once again, Tua Tagovailoa stands out within this data set with a league-high 112.7 QB Rating (QBR), 0.357 Expected Points Added (EPA) per drop back, and the second-highest Money Throws rate (Money Throws per pass attempt) at 8.06%. At this point, Tua has done more than enough for me to consider him an upper-level QB in the NFL, as his peripherals are impressive across multiple statistics. Of course, having two stud WRs (Tyreek Hill and Jaylen Waddle) helps a QB achieve the numbers we have seen from Tua, but I have seen rumblings of that somehow being a knock on him, which is ridiculous. Now, Money Throws are not a panacea metric directly correlating to fantasy production. This is shown by some of the other names atop this list (Derek Carr, Jacoby Brissett, Davis Mills, and Russell Wilson). But these are NFL QBs. These are the best QBs on the planet and they are going to make some impressive throws. But as with any statistic, there is the other end of the scale. Trevor Lawrence and Kenny Pickett are the last two names, both with a Money Throw rate under 2.0%.
I’ll bring up Geno Smith one last time. I am biased as a Seahawks fan, but Smith has been one of the biggest (and best) surprises this season. And this is the data we have. If certain QBs like Tua and Geno Smith are standing out across multiple QB peripheral statistics, that means something. Along with the top-level efficiency metrics shown earlier with Smith, he also has the third-highest QBR (behind only Tua and Patrick Mahomes), the eighth-highest Money Throw rate, and the sixth-highest EPA per drop back. I didn’t mention Smith with the Turnover data, but he also has the fourth-lowest interceptions per drop back rate (1.1%) and the third-highest TD-interception ratio (4.3). Something that was nowhere near my mind at the start of the season, I truly believe the Seahawks already have their QB of at least the near future.
Thanks for reading! If you have any questions about the data used in this article or about fantasy football in general, feel free to hit me up on Twitter.

