
FantasyData: Touchdown Regression
Statistical regression can be looked at in a variety of ways. The regression I look at in this article is the regression of fantasy football data points toward the mean (average) of a chosen data set. More simply put, I am looking at touchdown percentage in 2021 for players at the running back, wide receiver, and tight end position compared to historical averages over the last 10 seasons. I will be looking at the 2021 top 36 fantasy RBs, top 36 fantasy WRs, and top 24 fantasy TEs, all in half-point per reception format.
The purpose of this analysis is to find players at each position who had an abnormally low TD% in 2021 compared to the historical average at the position, who may be in line for positive TD regression in 2022 back toward the historical mean.
As with any statistical metric, TD% viewed without additional context can be misleading. For example, newly-signed Dolphins’ RB (and former Cardinals’ RB) Chase Edmonds didn’t score his first TD of 2021 until Week 8 and finished the season with only two rushing TDs and a rushing TD% (total rushing TDs divided by rushing attempts) of 1.3%. Granted, Edmonds missed five games in 2021, but his TD% ranked 41st among RBs with at least 100 attempts, and the “per attempt” nature of TD% accounts for missed games. The 10-year average for TD% among top 36 RBs (2012-2021) is 3.13%, almost three times Edmonds’ 2021 rate. If looking only at TD%, this may look like an outlier on the negative side of the mean and would indicate a higher probability of a TD% increase for Edmonds in 2022. While Edmonds could very well score a TD on more than 1.3% of his carries in 2022, the cause of his lower TD% becomes clear with additional context.
The Cardinals did not re-sign Kenyan Drake before the 2021 season, so initial speculation included a big role for Edmonds, who had played a more complementary RB role up until that point in his short career. Edmonds was somewhat polarizing in the fantasy community once Drake headed to the Raiders, with some seeing a greatly expanded role and fantasy success, and others concerned about his size (even though his size/speed comparison is Aaron Jones), him never having been a primary RB before and the likelihood the Cardinals would bring in a free agent. This is exactly what happened when the Cardinals signed free agent RB James Conner, widely seen as the more likely “goal-line” RB when forecasting the 2021 season. And this is what played out. Edmonds’ role did increase compared to previous seasons, but with very little work in the red zone. Conner became the goal-line RB, leading the league with a 7.5% TD% and finishing only behind the Colts’ Jonathan Taylor in carries inside the 10- and 5- yard lines.
This example with the 2021 Cardinals backfield is not intended to be a significant or unknown revelation. Edmonds is now a Miami Dolphin and whether Conner can sustain that high of a TD% is a separate conversation. The purpose is to drive home the point (with an obvious example) that when looking at specific metrics in an attempt to predict the probability of future results, you have to ask additional questions. Just because something is below average does not mean it will automatically regress toward the average, so you have to look at causes for the sub-par data and potential obstacles standing in the way of positive regression. Is there a logical trail of breadcrumbs pointing toward an explanation, as with the Edmonds example, or does it look more like a potential outlier for that player?
Starting with WRs, in this article I’ll look at historical TD% rates along with a closer look at one player at each position (WR, RB & TE).
Wide Receiver Historical TD%
To arrive at an average TD% for comparison I looked at the top 36 WRs (0.5 PPR) for the last 10 seasons (2012-2021). Using the simple TD% calculation (receiving TDs divided by targets), the following table shows the average TD% for each of the 10 seasons as well as the 10-year average. I broke the numbers down to the top 36, top 24, and top 12 for each season (and 10-year average).
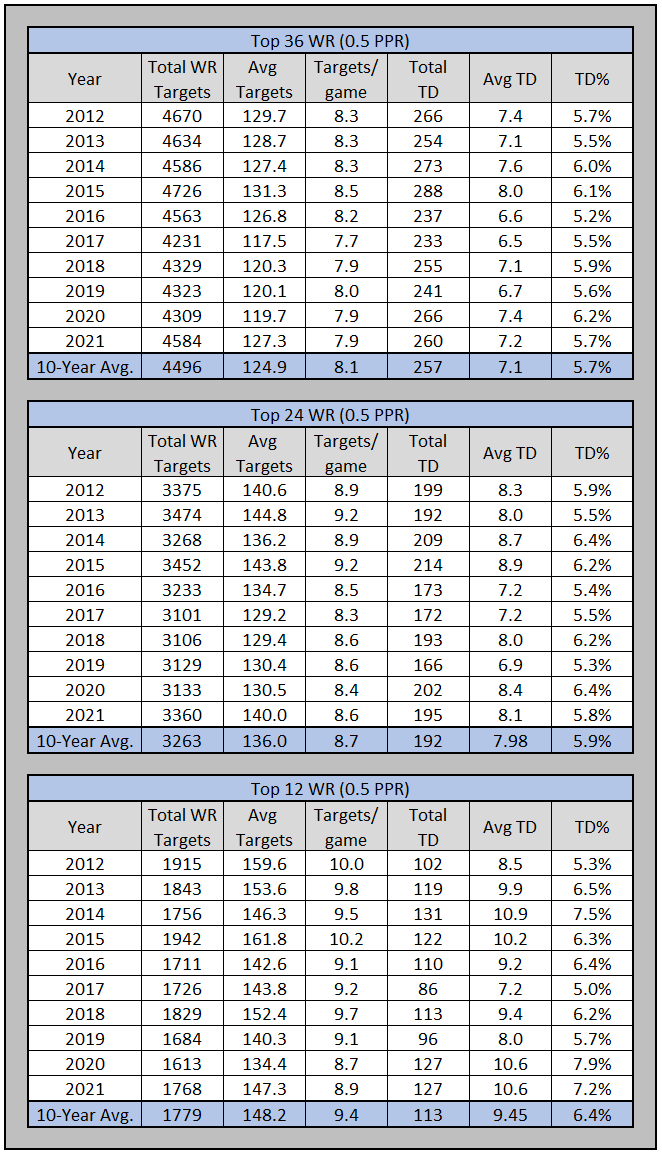
You see the following average WR TD% over the 10-year span:
- Top 36 WR: 5.7%
- Top 24 WR: 5.9%
- Top 12 WR: 6.4%
Now that we have an average based on a decent sample size, we can use that to compare individual TD% of WRs from the 2021 season to first determine who underperformed in this category. Can we reasonably expect a potential positive regression to the mean in 2022?
 Sign Up Today To Continue Reading…
The rest of this article is for FantasyData Subscribers only. Luckily for you, now is one of the best times of the year to subscribe. We are offering amazing deals on our Annual subscriptions. That means you get all our awesome data, content, projections, rankings, and tools along with downloadable data for one full year. You will be set up for the rest of this NFL season and almost all of next year!
2021 Wide Receivers
Looking at the top 36 PPR WR in 2021, the following table includes standard WR statistics and is sorted by TD%.
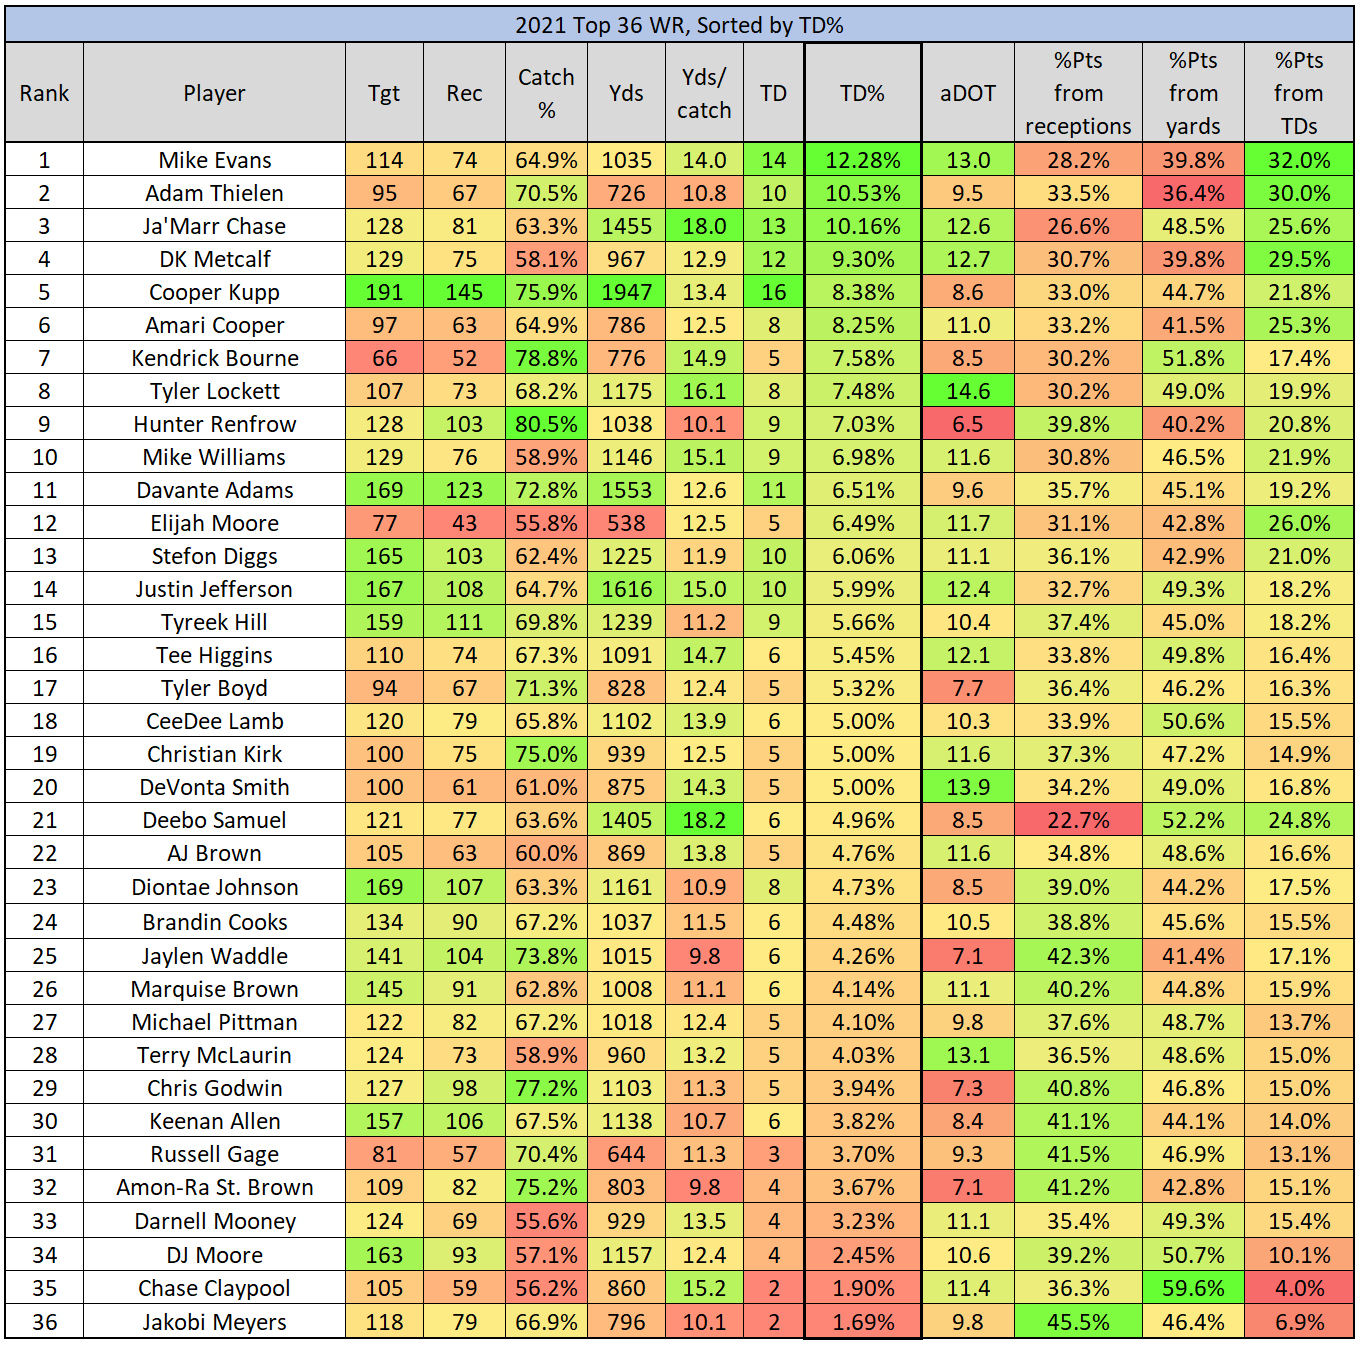
There are multiple WR that would merit discussion here, but I will be looking closely at one WR near the bottom of the TD% ranking.
Chase Claypool
Chase Claypool stands out not only due to his 35th ranked TD% (1.9%) but also because he was on the opposite end of the spectrum in 2020, with a TD rate of 8.3% (8th overall). Claypool was well above the 10-year average TD% of 5.7% for the top 36 WR in 2020. Was there a significant difference in Claypool’s volume between the two seasons? The answer is no, in fact, his surface numbers were virtually the same:
- 2020: 109 targets, 62 receptions, 873 yards, 14.1 yards per reception, aDOT: 13.2
- 2021: 105 targets, 59 receptions, 860 yards, 14.6 yards per reception, aDOT: 11.4
TD result: Nine receiving TDs in 2020; only two in 2021.
So, what about another go-to for deciphering TD information: red zone usage?
- 2020: 13 red zone targets, nine targets inside the 10, five targets inside the five.
- 2021: 13 red zone targets, seven targets inside the 10, four targets inside the five.
Again, like his standard volume statistics, no real change in Claypool’s red zone usage either. Part of the answer lies in another of Claypool’s statistics from 2020, his average yards per receiving TD. In 2020, Claypool’s nine receiving TDs averaged 26.6 yards per TD, 6th highest among top 24 WRs in 2020 (4th highest if you exclude WRs with less than five TD catches).
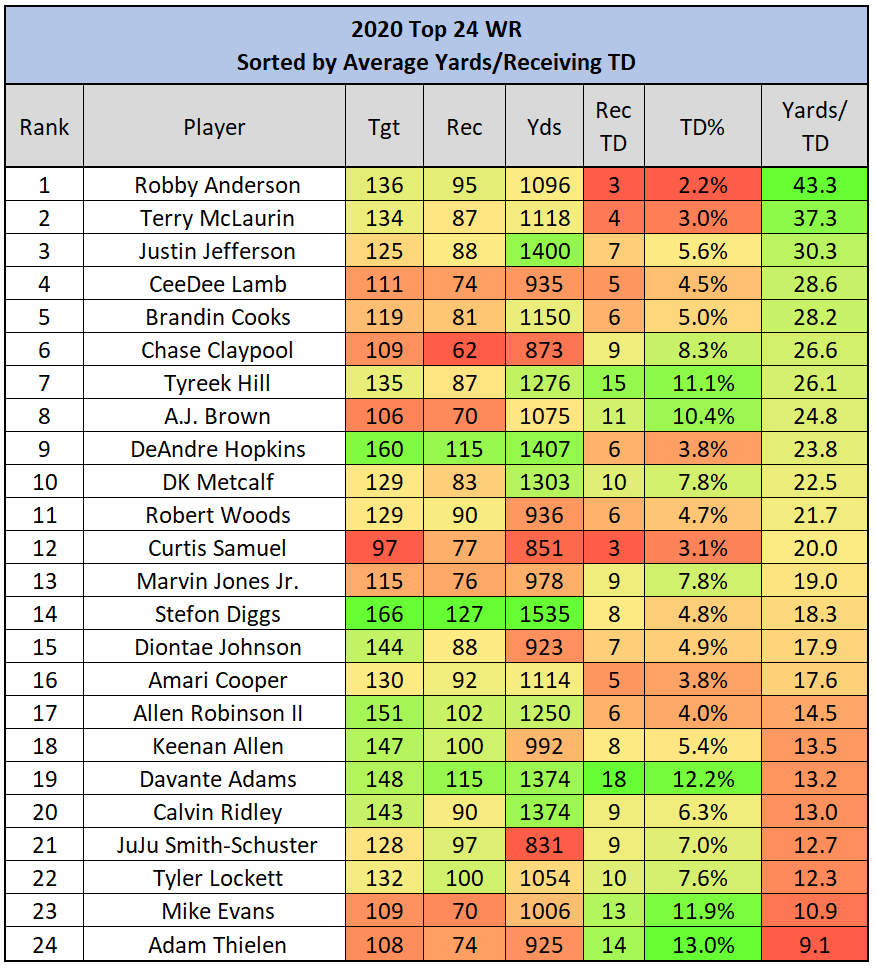
You can see why red zone usage has not played a role in this TD% swing. Claypool caught a lot of relatively long TD passes in 2020 and he was unable to match that in 2021. Maintaining an above-average TD% while relying on 25+ yard TD receptions (on average, albeit within a small sample size) is difficult.
Regarding Claypool in 2022, I believe both Claypool’s 2020 TD rate of 8.3% and his 2021 TD rate of 1.9% were outliers and he will fall closer to the 10-year average of 5.7% this season. In 2021 that rate would have netted him six TD receptions which would have put him at WR29 on the season. And this is where I forecast Claypool, as a high-end WR3 with TD upside. Whether or not the recently signed Mitch Trubisky will help or hinder Claypool’s potential positive regression is yet to be seen. Trubisky will likely be better than 2021 Roethlisberger and most definitely is a better option than Mason Rudolph. And it isn’t like Roethlisberger was lighting the world on fire with his deep ball the last two seasons, finishing with the following deep ball (20+ yard passes) completion percentages:
- 2020: 72 deep ball attempts, 27.8% completion rate (29th)
- 2021: 63 deep ball attempts, 30.2% completion rate (28th)
Tight End Historical TD%
Like historical WRs, I looked at the top 24 TEs (0.5 PPR) for the last 10 seasons (2012-2021). The following table shows the average TD% for each of the 10 seasons as well as the 10-year average. I broke the numbers down to the top 24 and top 12 for each season (and 10-year average).
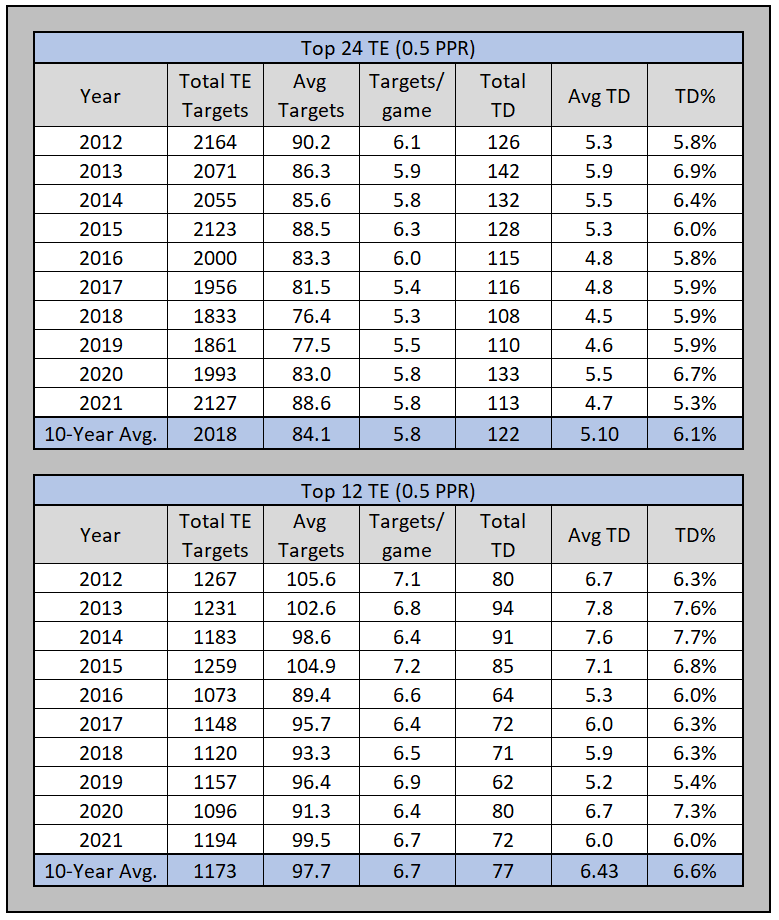
You see the following average TE TD% over the 10-year span:
- Top 24 TE: 6.1%
- Top 12 TE: 6.6%
2021 Tight Ends
Looking at the top 24 PPR WR in 2021, the following table includes standard TE statistics and is sorted by TD%.
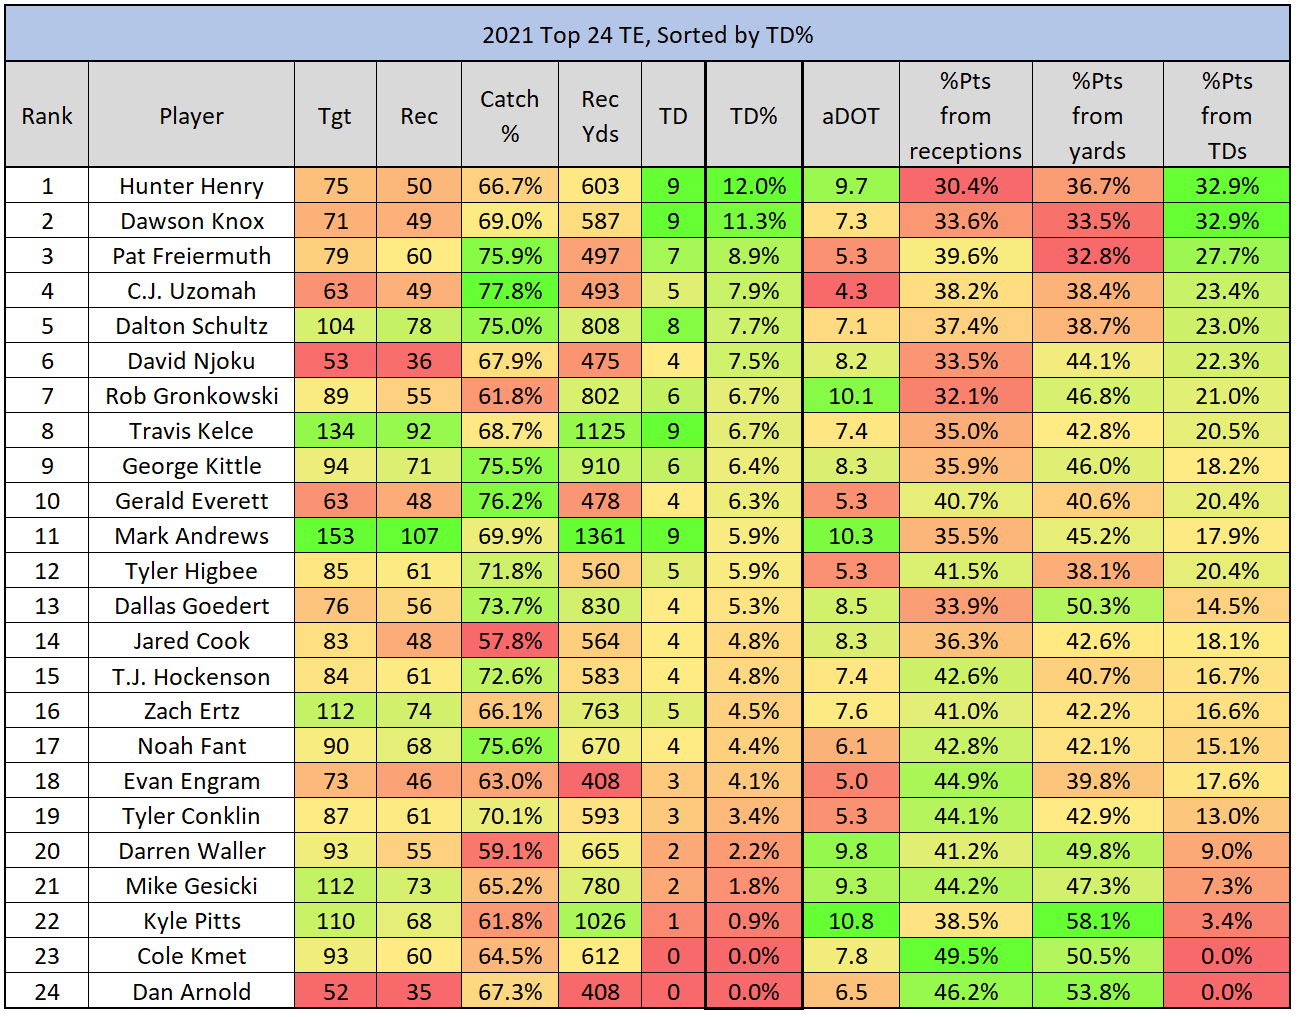
Perhaps the lowest hanging fruit of this entire study found himself near the bottom of the TE TD% ranking in 2021.
Kyle Pitts
Kyle Pitts had an excellent rookie season, both from a one-season and historical viewpoint. He entered the NFL with a crazy amount of hype, so there wasn’t an outcome that would have lived up to the hype other than busting into the current upper echelon of TEs right away. Pitts finished the season with 1,026 receiving yards (3rd-most) on 110 targets, joining Mike Ditka as the only other TE to eclipse the 1,000-yard mark as a rookie. Pitts finished as the TE6 on the season, which again one would typically take from a rookie TE every day of the week. But to some, this was disappointing based on the hype.
Almost unbelievably, Pitts caught only one TD pass on the season. One TD reception on 110 targets. This is what I meant by “low hanging fruit” for this article. A TD% of 0.9% is a ridiculous outcome based on Pitts’ other numbers. I don’t know how else to say it. And not just based on the 10-year averages for top 12 and top 24 TEs shown above. The following is the list of each TE from 2012-2021 to accumulate 1,000+ yards on 100+ targets, and their corresponding TD%.
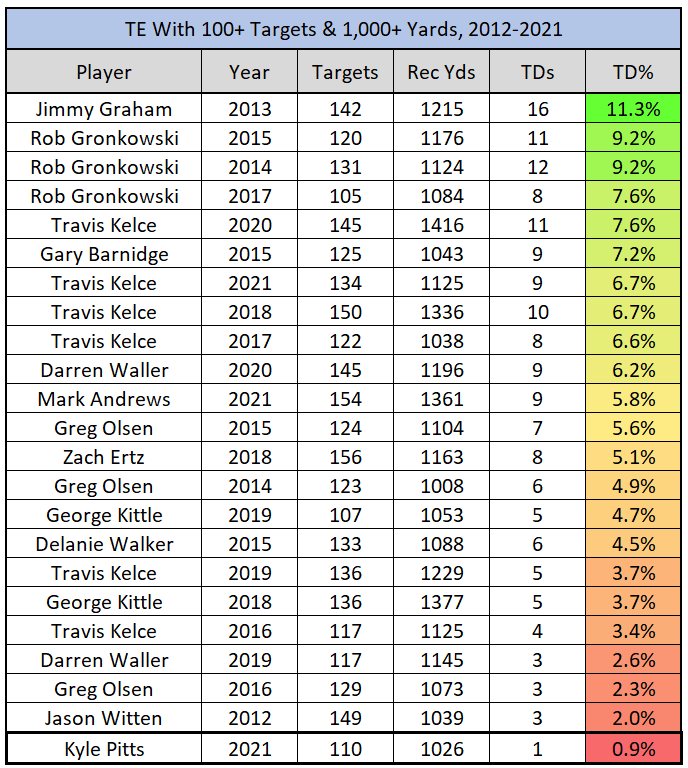
This paints a clear picture that Pitts is one of the more likely positive TD regression candidates in recent memory. Again, as a hypothetical, if Pitts had been at the 10-year average TD% (for top 12 TEs) of 6.6%, that would have given him 7.3 TDs instead of one. In PPR formats that would have bumped him from 176.6 to 220.4 total points, which would have been the TE3 behind Mark Andrews and Travis Kelce.
I realize this was also a product of a bad overall offense in Atlanta that was even worse in the red zone. The Falcons ranked 24th in Red Zone TD%, scoring TDs on only 53.9% of their trips inside the opponent’s 20-yard line. Pitts led the Falcons’ pass catchers in targets from inside the 20-, 10- and 5-yard lines and he likely will again in 2022, especially with the one-year suspension being served by WR Calvin Ridley. We just witnessed Pitts’ absolute floor, which was still good enough for TE6 on the season. With the volume he saw as a rookie combined with a more than likely uptick in TD receptions, Pitts is a perennial top 5 TE with overall TE1 upside.
Running Back Historical TD%
For RBs I included two different TD% metrics. I looked at the top 36 RBs (0.5 PPR) for the last 10 seasons (2012-2021). Along with the typical RB TD% (rushing TDs divided by rushing attempts) is Opportunity (Opp) TD% (total TDs divided by total opportunities). I wanted to see if there was a noticeable difference between the two with the increased prevalence of dual threat RBs over the last 10 years. The following table shows the average TD% for each of the 10 seasons as well as the 10-year average. I broke the numbers down to the top 36, top 24, and top 12 for each season (and 10-year average).
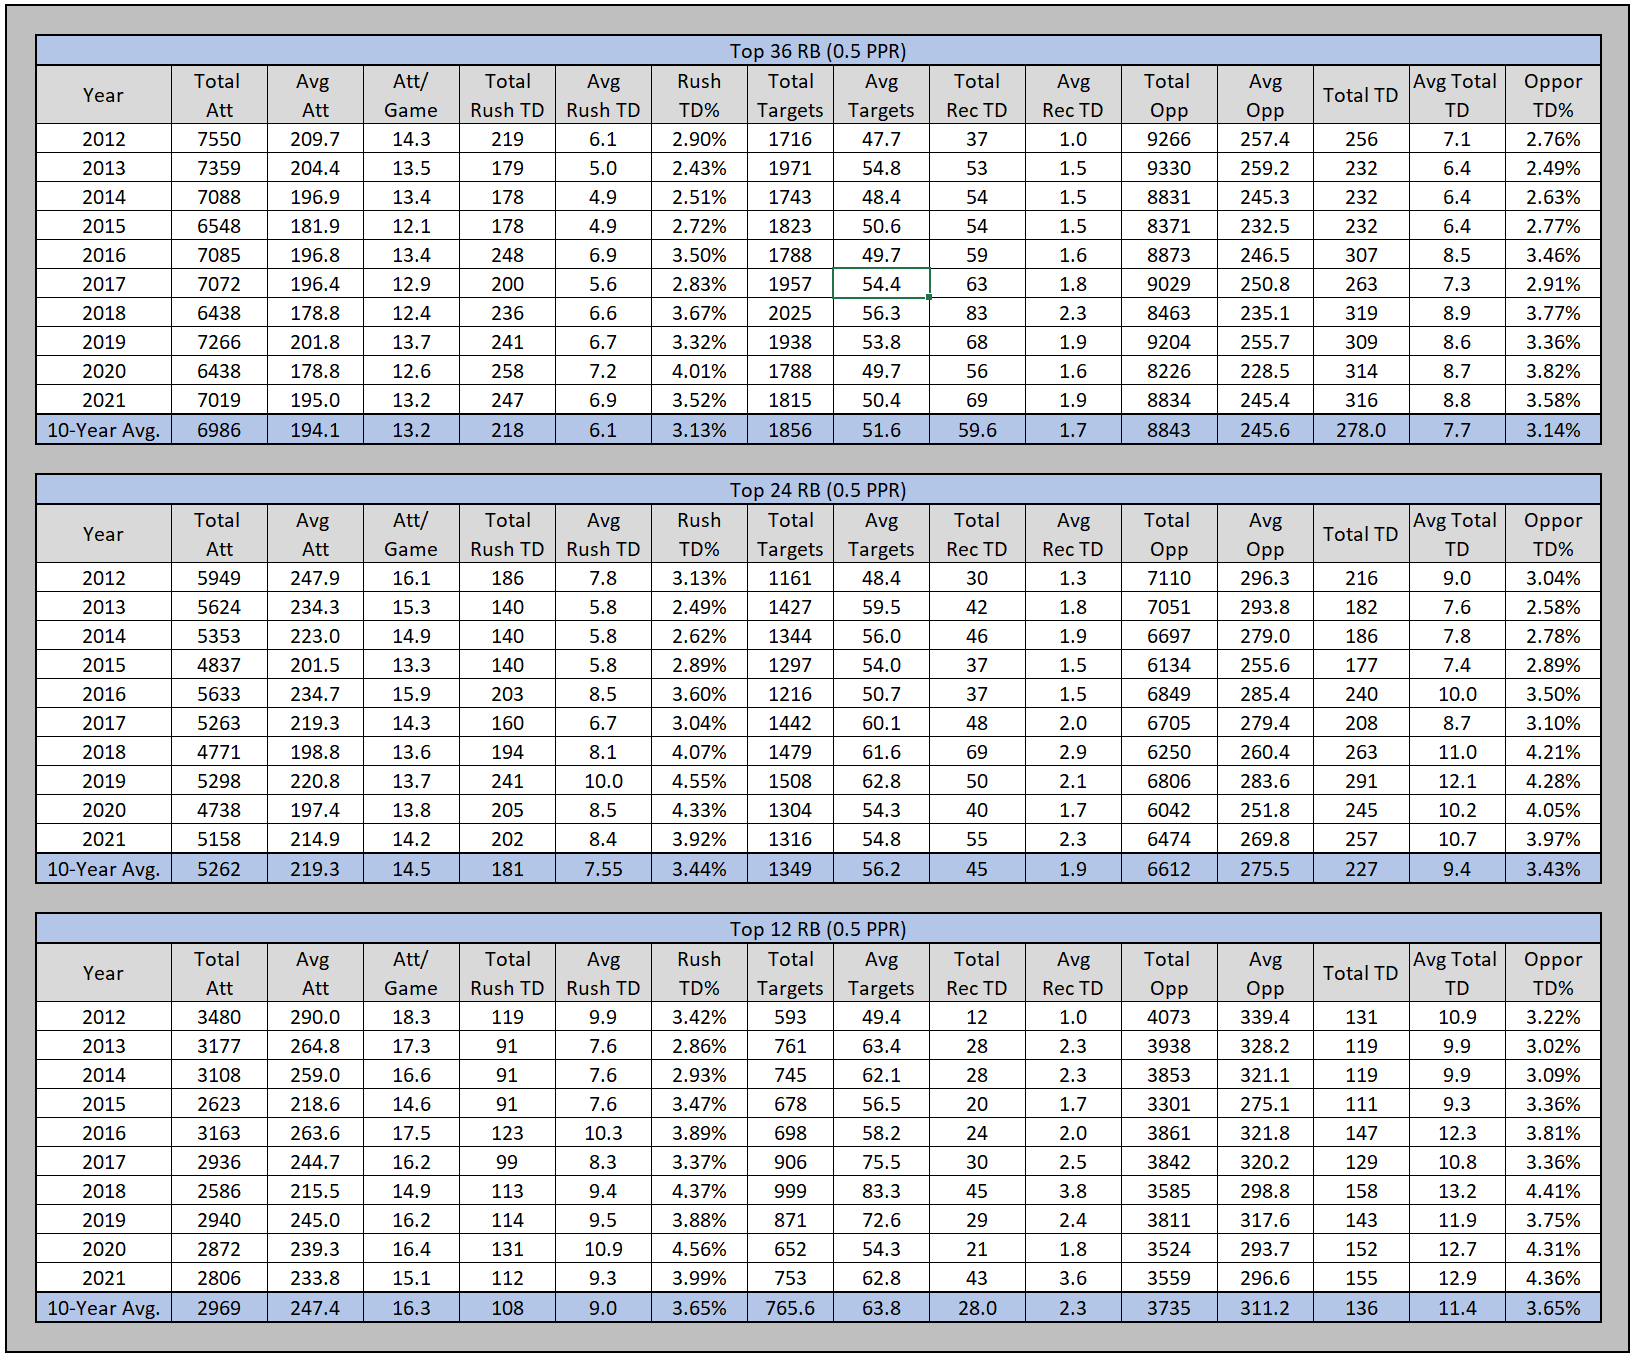
You see the following average RB TD% over the 10-year span:
- Top 36 RB TD%: 3.13%
- Top 36 RB Opp TD%: 3.14%
- Top 24 RB TD%: 3.44%
- Top 24 RB Opp TD%: 3.43%
- Top 12 RB TD%: 3.65%
- Top 12 RB Opp TD%: 3.65%
Oddly enough, a running back’s TD% doesn’t change when going from rushing TD/attempt to total TD/opportunities. So, for the next section, I will simply use RB TD% as the comparison.
2021 Running Backs
Looking at the top 36 PPR RB in 2021, the following table includes standard RB statistics and is sorted by TD%.
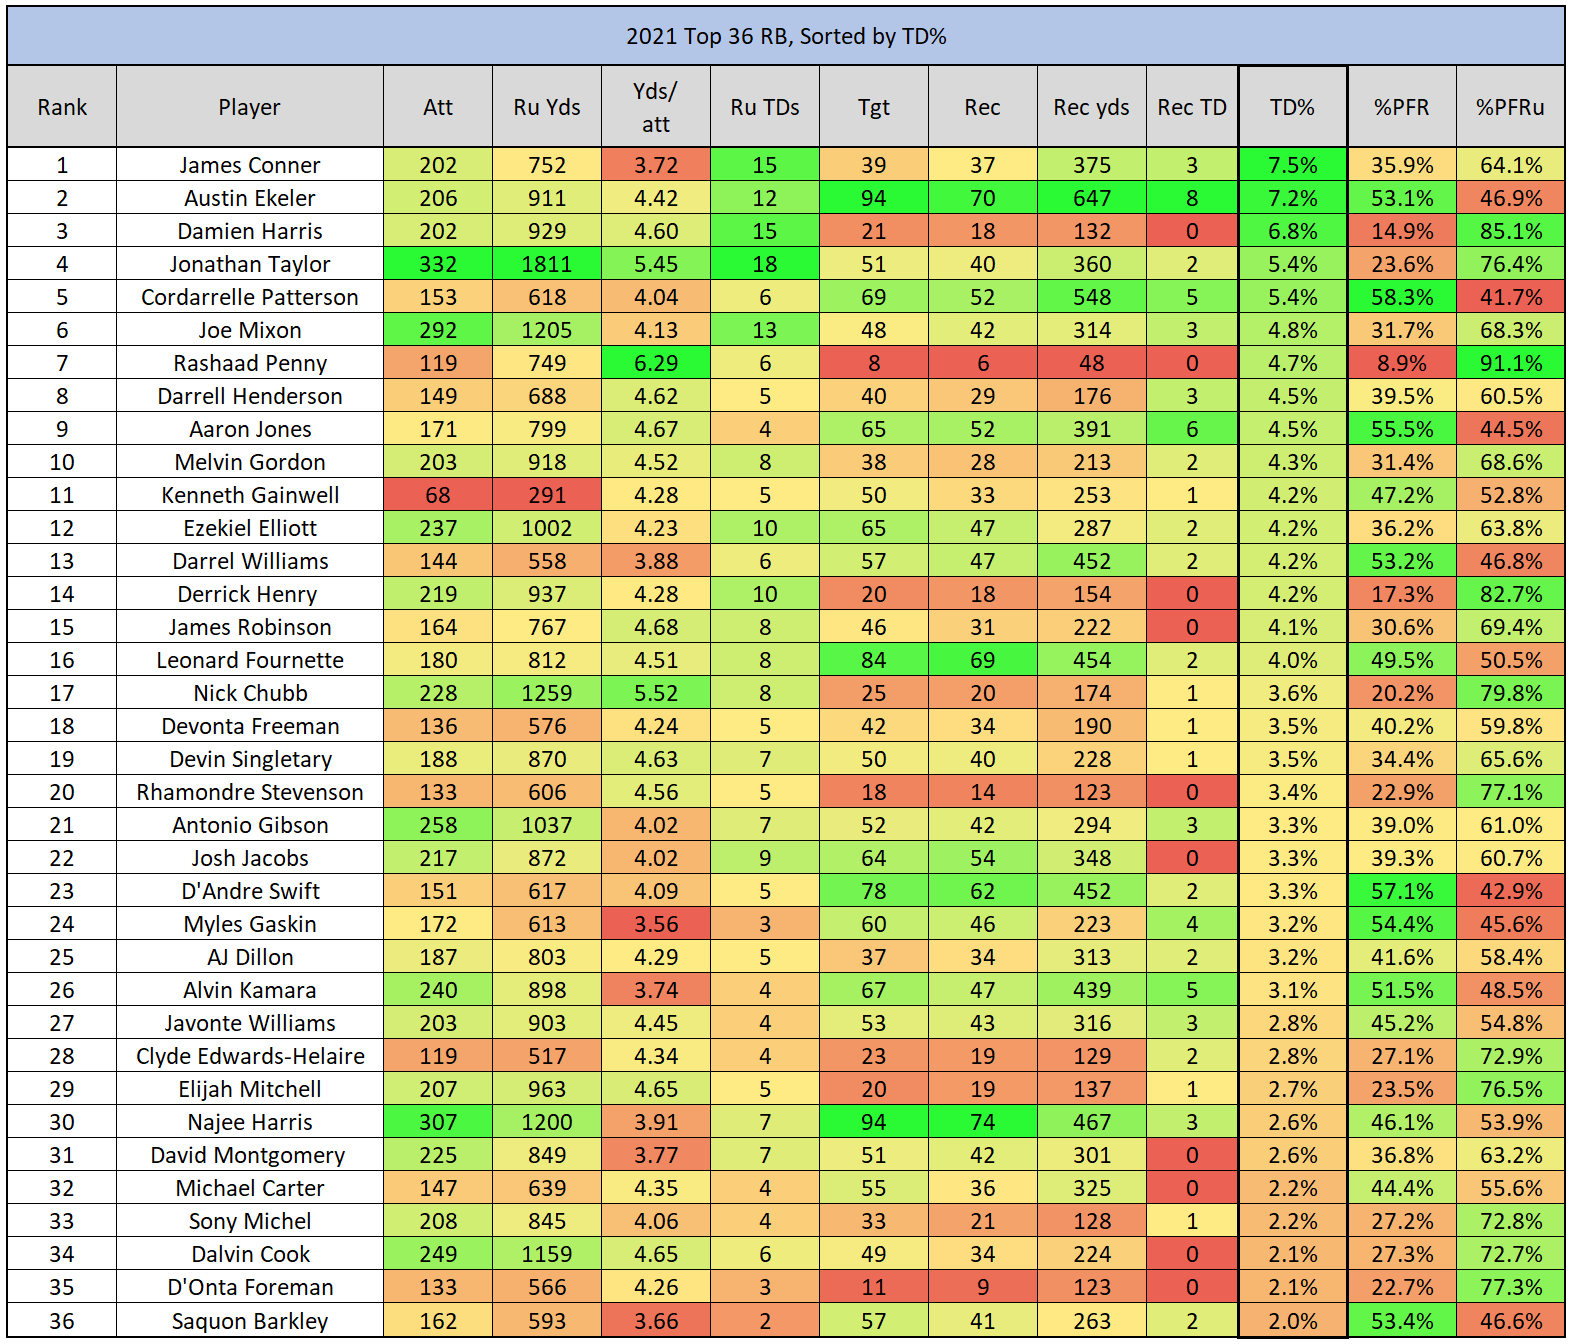
Dalvin Cook
Dalvin Cook finished the 2021 season as the RB15 (0.5 PPR, total points), finishing outside the top 12 for the first time since 2018. He went from averaging at least 19 fantasy points per game (ppg) in 2019 and 2020 (top 5 both seasons) to a 14.6 ppg average in 2021. This was still an RB1 in ppg (RB11), but not the result expected coming into the season, shown by Cook’s 2021 redraft Average Draft Position (ADP) of RB2 (according to FantasyPros).
Except for rushing TDs, Cook’s general RB rushing statistics did not take a major dive in 2021:
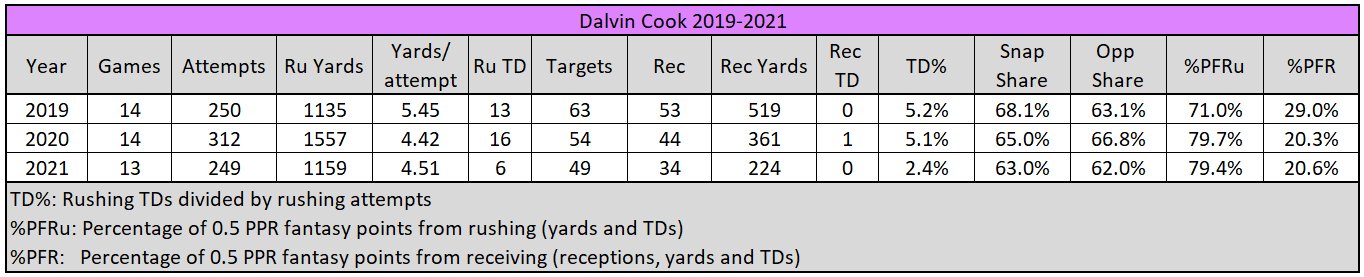
But his rushing TD output and corresponding TD% were cut in half. And this was not due to a lack of offense in Minnesota. The Vikings were middle of the pack in points scored and offensive TDs, but top 10 in Red Zone TD%.
What stands out about the Vikings is the team passing TDs comprising 77.3% of their total offensive TDs in 2021, the second widest Passing TD/Rushing TD ratio in the league behind only the Rams. With only eight total rushing TDs (eclipsing only the Texans), the Vikings’ total offensive TDs on the season were disproportionately of the passing variety. Exactly why this was the case will take more digging, but I see it as a major contributing factor in Cook’s significantly below average TD% in 2021, and a rate that will likely regress back toward the mean in 2022 as well.
If you apply the 10-year average for RB TD% (for top 12 RBs) to Cook’s 2021 numbers, it would have given him 9.1 rushing TDs pushing him up to RB9 on the season. Still disappointing but at least in the RB1 group. More concerning with Cook has been his steady decline in receiving output over the last three seasons, another topic for another day.
Conclusion
When it comes to both real-world and fantasy production in the NFL, touchdowns are referred to as one of the “least sticky” statistics to rely on, meaning TD production doesn’t “stick” at a similar rate over time, especially compared to the other fantasy scoring methods (receptions and yards). TD regression is a concept available to us that can assist in making an educated guess with this non-sticky stat. TD% is a helpful metric in that endeavor because you can generate a mean to which the regression occurs. And because it is a rate, it is not necessarily directly tied to games played like total TDs. However, other than Kyle Pitts where positive TD regression by itself gives me confidence Pitts is in for a big season, for the most part analyzing and predicting based on TD regression via TD% requires a series of additional questions depending on the situation of an individual player.