
Fantasy Football WR Expected Points and Strength of Schedule
Another week of NFL football, another pile of data to sift through looking for clues. Clues as to what leads to certain results and clues for speculating what might be coming next. They say, “Looks can be deceiving.” The same can be said for surface-level statistics in fantasy football. In this weekly article series, I will be looking beneath the statistical surface, beyond the standard box score, using the premium statistics provided by FantasyData, including advanced and efficiency metrics across the fantasy skill positions, to search for puzzle pieces that fit together.
Expected Fantasy Points, FPOE, and Strength of Schedule: Top 40 WRs
Week 10 of the NFL season is upon us. A few weeks ago, I dove into the Top 40 RBs. Specifically, I looked beneath the surface of the thing that ultimately drives the fantasy football bus: Fantasy points. Fantasy points per game, Expected Points per game, Fantasy Points Over Expected (FPOE), and fantasy strength of schedule based on adjusted fantasy points allowed rankings.
In this article, I will be looking at the points per reception (PPR) Top 40 WRs, based on fantasy points (FPTS) scored per game (PPG). This Top 40 group includes a minimum of five games played and does not include the Week 10 Thursday Night Football between the Bears and Panthers.
I will be looking Expected Fantasy Points (xFP) and FPOE. I will break down the analytical concept of expectation further by also looking at Expected Reception, Receiving Yards, and Receiving TDs to see which WRs have been overperforming or underperforming, and where we might expect regression in the second half of the season. All “Expected” data is from Pro Football Focus (PFF).
You can find the Week 8 article about RBs here. In that article, I provided a brief explanation of these advanced statistics and will repeat that here, as it is helpful to know why these metrics are helpful.
Expected Points for individual players factor in specific context that attaches varying degrees of value to each opportunity (targets, rush attempts, and receptions). The idea behind EP and FPOE is that not all opportunities are the same. Some opportunities are more valuable than others. For example, a WR who gets five red zone targets would be more appealing than a WR who gets five targets between the 20s. The box score will only show the five targets for both players, but the Expected Points would be higher for the WR receiving the red zone targets. A red zone target is considered higher value than a target between the 20s because of the increased odds of that target resulting in a TD. Similarly, a higher expected points value is attached to RB targets compared to RB rush attempts. There are a variety of variables comprising the recipe for EP:
- Value of rush attempts vs targets
- Down and distance
- Yard line
- Depth of receiving target
With xFP you can calculate FPOE, which shows the players who are underperforming or overperforming in PPG compared to what is expected. With expected receiving yards (xRY) and expected TDs (xRTD) you can look further to see what is driving the “Over Expected” differences.
I will conclude with the fantasy Strength of Schedule for the Top 40 WRs. This will include SOS to date (Weeks 1-9), the rest of the fantasy season (Weeks 10-14), and Fantasy Playoffs (Weeks 15-17).
For the charts in this article, the column by which the data is sorted will have a yellow-highlighted column title.
Top 40 WRs: Fantasy Points, Expected Points, and FPOE
This first chart is sorted by actual PPG, This Top 40 is based on a minimum of three games played, and players currently out for the season with injuries are not included. The columns are arranged as follows (from left to right):
- PPG Rank: Current rank in PPR PPG
- xFP/Game (xFPPG) Rank: This would be the rank if each RB scored at their xFP
- Rank difference: Difference between PPG Rank and xFP/Game Rank. A higher difference between these ranks indicates a higher FPOE (a green-shaded number here will always correspond with a green-shaded FPOE/Game, and vice versa with red-shaded numbers)
- Player, Team, Games Played
- Actual PPG
- xFPPG
- FPOE/Game: Difference between actual PPG and xFPPG
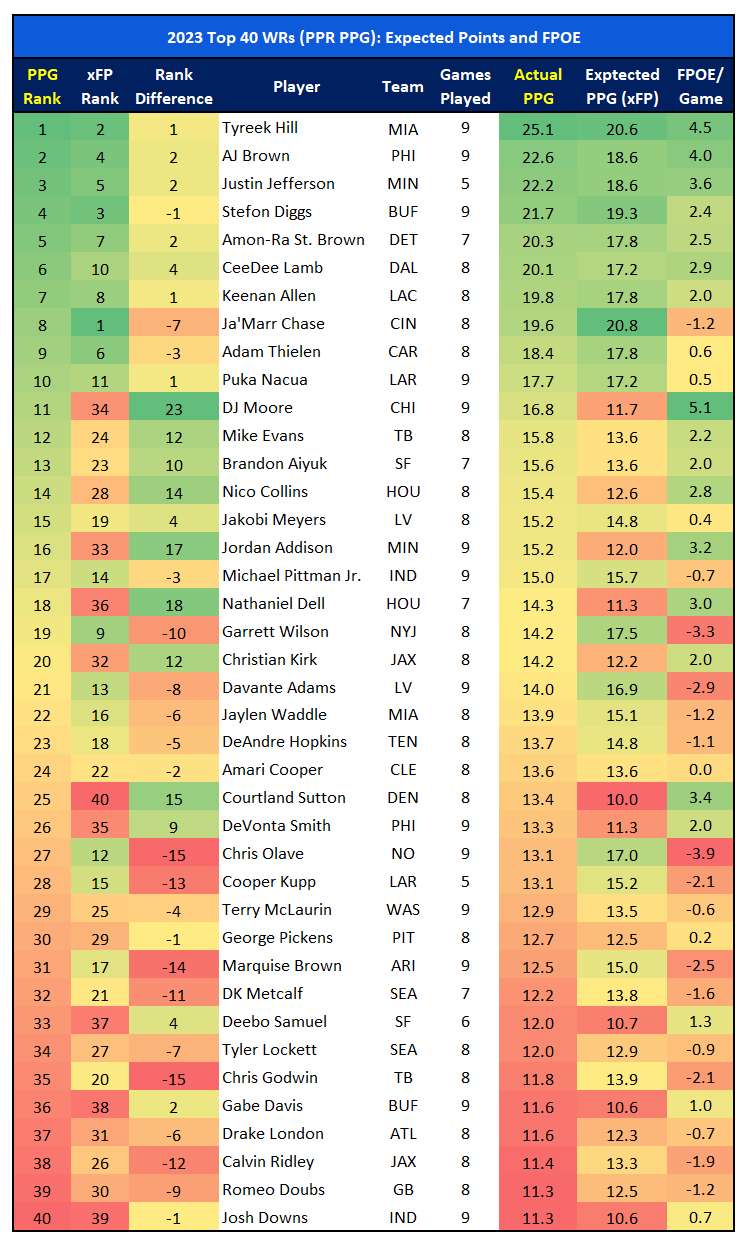
Seven of the current Top 10 WRs were also ranked in the Top 10 according to FantasyPros Expert Consensus Rankings (ECR) at the start of the 2023 season. Two of the three WRs currently in the Top 10 who were not there in the ECR preseason rankings, Puka Nacua and Adam Thielen, are complete surprises. The third WR is Keenan Allen, which is not a surprise. But Nacua and Thielen’s fantasy success thus far is not due to massive overperformance. Each has a positive FPOE, but both are under one PPG above expected. An FPOE closer to zero doesn’t mean a player cannot improve or get worse, rather, they do not stand out as much as a candidate for regression.
What Nacua and Thielen are doing is even more impressive because they have not been relying on significant overperformance. Until recently, success for both has been sustained since the beginning of the season. For instance, both WRs are outside the Top 10 highest TD rates. TDs are a good thing for fantasy football, but a high TD rate typically is not sustainable, so it is one of the first places I look when forecasting future regression.
Nacua’s TD rate is 2.1% (39th) and Thielen’s is 5.3% (16th). Both are candidates for positive TD regression. Along with xFP, PFF also generates expected receptions, receiving yards, and TDs. Nacua has been above expectation for receiving yards, with the 11th-highest receiving yards over expected (RYOE) per game of 6.6 yards. One method in which Nacua is attaining this is yards after catch (YAC). Nacua has averaged 5.0 YAC per reception, which is the 12th-highest mark among the Top 40 WRs.
Outside of QB issues, there is no reason to think this isn’t sustainable for Nacua because his peripherals are elite. Cooper Kupp has played alongside him in four of eight games, and this is where Nacua’s numbers are at:
- Target Share: 31.9% (5th)
- Route participation: 92.9% (13th)
- Targets Per Route Run (TPRR): 29% (4th)
- Yards Per Route Run (YPRR): 2.5 (Tied for 6th)
- YAC Per Reception: 5.0 (12th)
- EPA Per Target: 0.44 (14th)
- Weighted Opportunity Rating (WOPR): 0.71 (10th)
And these numbers have declined for Nacua over the last two games without Matthew Stafford. Two weeks ago, Nacua was second in YAC/Reception and higher on the leaderboard in EPA/Target and WOPR. If Brett Rypien were named the starter for the rest of the season I would be concerned about Nacua. But the Rams signed Carson Wentz, so it will either be him or a combination of him and Stafford. Wentz is not a QB savior, but he is a much better option than Rypien.
Here are the same Top 40 WRs sorted by FPOE per game from lowest to highest. I have added the following metrics to this chart:
- Route Participation
- Target Share
- Targets per Route Run (TPRR)
- Yards per Route Run (YPRR)
The purpose of this combination of metrics is it provides a statistical view of WRs for whom the probability of regression (either positive or negative) is higher. I will highlight multiple WRs to show you what I mean.
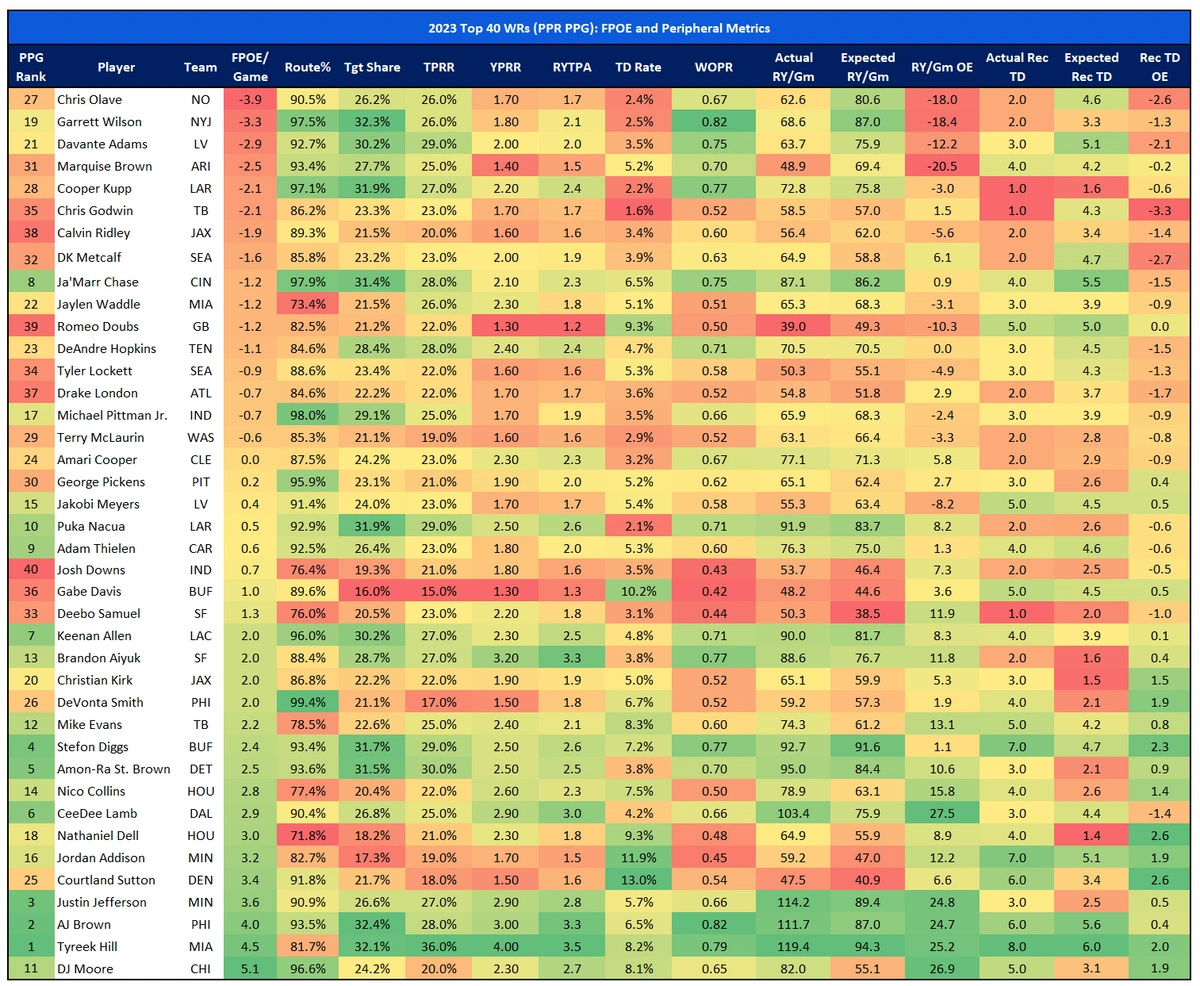
I realize this is a lot of data point for one chart. I will explain the best way to approach this and what to look for as I go through my player spotlights.
Garrett Wilson
Garrett Wilson currently has the second-lowest FPOE per game, averaging 3.3 PPG below expectation. There are multiple reasons why Wilson has been underperforming. We can all daydream about “what would have been” if Aaron Rodgers had not suffered a season-ending injury 94 seconds into the season opener. But our current reality is one with Zach Wilson as the starter for the Jets. According to PlayerProfiler, Wilson’s catchable target rate is 64.2%, meaning only 64.2% of his targets have been deemed catchable. This ranks 81st among NFL WRs this season. This is the crucial piece in Wilson’s negative FPOE per game as fantasy points are not awarded for target share and snap share.
It is why Wilson has the second-lowest receiving yards over expectation (RYOE) per game. According to PFF’s expected stats data, Wilson is producing 18.4 receiving yards per game below expectation. The only WR farther below expectation for receiving yards is Marquise Brown (-20.5; more on Brown later). The other driver of Wilson’s underperforming is TDs. Wilson has seen 12 red zone targets, which ranks seventh among WRs according to Player Profiler. And that is with one fewer game played than teams who have not hit their bye yet. The TD category is not as drastic for Wilson, as he has scored 1.3 fewer TDs than expected on the season (tied for 8th-lowest). But the value of red zone targets and Wilson having earned the seventh-most drives up his xFP, so TDs are playing a role in his low FPOE.
The other thing I like to look at alongside FPOE is target share. Target share is not 100% correlated with fantasy points, but it is a relatively effective predictive metric. A higher target share next to a lower FPOE stands out and also indicates potential positive regression. Look for an orange-red FPOE next to a greenish target share. When compiling and presenting these data sets, that is where I typically start in the search for regression candidates. And it is the same in the other direction with a lower target share and higher FPOE. If you want to see the impact of good versus bad QB play by looking only at a few metrics, look no further than AJ Brown versus Wilson. Brown leads the NFL in target share (32.4%) and has the third-highest FPOE per game, scoring four points above expectation per game. Wilson has the second-highest target share in the NFL (32.3%) but has the second-lowest FPOE per game. I am not saying that Wilson is a better WR than Brown. But they are a lot closer talent-wise than these numbers would lead you to believe.
Here are Wilson’s peripherals and where he stands among the Top 40 WRs:
- Route Participation: 97.5% (4th)
- Target Share: 32.3% (2nd)
- WOPR: 0.82 (Tied for 1st with AJ Brown)
- TPRR: 26% (Tied for 6th)
- YPRR: 1.8 (Tied for 13th)
- RYTPA: 2.1 (Tied for 11th)
- TD Rate: 2.5% (36th)
You can see where Wilson’s numbers start to dive based on a below-average QB. He is running the routes, earning the targets, and dominating the WR market share for the Jets. His 81st-ranked catchable target rate starts to show up as he leaves the Top 10 in YPRR and RYTPA, and his TD rate screams regression. Even with Zach Wilson at QB, I think Wilson has positive regression in his future with those market share numbers, and I would be trying to buy low in redraft leagues.
Chris Olave
When I started this article I assumed the conversation about Chris Olave would be similar to Garrett Wilson. Olave has the lowest FPOE per game in this group at -3.9. Scoring almost four fewer PPG than expected is significant and the main reason Olave has been a major disappointment this season. And I am slightly less optimistic about Olave positively regressing to the WR1 many ranked him as (including me) entering the 2023 season. Olave is still an example of greenish shading across many of the peripheral metrics, next to the orange-red FPOE. But his peripheral metrics are good, but not great, across the board:
- Route Participation: 90.5% (17th)
- Target Share: 26% (18th)
- WOPR: 0.67 (14th)
- TPRR: 26% (Tied for 6th)
- YPRR: 1.8 (Tied for 14th)
- RYTPA: 2.1 (Tied for 14th)
- TD Rate: 2.4% (37th)
Olave and Wilson are in a similar place with TPRR, YPRR, and RYTPA. However, Olave has been somewhat average with routes, target share, and WOPR. That is where my outlook for these two WRs heads in slightly different directions. Olave’s catchable target rate is right around Wilson’s at 65.9% (76th according to Player Profiler), so QB play has affected Olave as well. But that has a more significant impact when running fewer routes and earning fewer targets. Olave has the third-lowest RYOE and TDOE. Both of those should see some positive regression, but again, unless Olave can improve his underlying peripherals, I do not see him making a significant leap in his FPOE.
Marquise Brown
Sticking with the talented WRs with a negative FPOE, Marquise brown enters Week 10 with the fourth-lowest FPOE per game, averaging 2.5 fewer PPG than expected. Brown has been slightly better than Olave across most metrics, although Brown is near the bottom of this group in YPRR and RYTPA. Brown’s TDOE is right around zero, meaning his actual number of receiving TDs is right around what is expected. Brown’s main area of underperformance has been with receiving yards, which makes sense with his low YPRR and RYTPA. Brown has the lowest RYOE of this group, averaging 20.5 fewer receiving yards per game than expected. The Joshua Dobbs story has been great, but he is not a top-tier QB. Brown’s catchable target rate of 61% ranks 88th in the NFL according to Player Profiler. And that brings us to the reason I am highly optimistic for Brown. Of the three WRs discussed so far, he is the only one getting a QB upgrade, and it’s a significant QB upgrade. I like Cardinals’ rookie WR Michael Wilson, and I am all aboard the Trey McBride train. But Brown should still see a significant share of this receiving market, and with Kyler Murray about to take the helm for the rest of the season, Brown is one of my biggest buys right now in redraft leagues.
Courtland Sutton
What goes up must come down. Now we move to a WR who has been overperforming and negative regression is in the air. Courtland Sutton has the fifth-highest FPOE per game, averaging 3.4 more PPG than expected. Sutton fits the description of a WR with a greenish-shaded FPOE and orange-red with his peripherals. Here are Sutton’s peripheral metrics and where they stack up among the Top 40 WRs:
- Route Participation: 91.8% (16th)
- Target Share: 21.7% (29th)
- WOPR: 0.54 (27th)
- TPRR: 18% (Tied for 13th)
- YPRR: 1.5 (Tied for 16th)
- RYTPA: 1.6 (Tied for 15th)
- TD Rate: 13% (1st)
Snuck that last one in there didn’t I? Receiving TDs is the reason for Sutton’s high FPOE per game. It is not receiving yards as he has the 16th-highest RYOE in this group. It’s TDs. He is tied for the highest TDOE (with Tank Dell) having scored 2.6 more TDs than expected. A 13% TD rate is not sustainable, and, even with that high rate for the most lucrative fantasy points generator, he is still only the WR25 in PPR PPG. This is due to his below-average numbers everywhere else. Which is why, once the inevitable TD regression hits, he’ll likely barely be a WR3 in fantasy football. Sell immediately if you can.
Fantasy Strength of Schedule (SOS) for the Top 40 WRs
Strength of schedule (SOS) for the fantasy skill positions is something I have tracked and generated on my own for multiple years now. I have tweaked and fine-tuned my process to arrive at “adjusted” fantasy points allowed opponent rankings versus fantasy QBs, WRs, RBs, TEs, and DSTs. I start with raw fantasy points allowed per game by each team for each skill position. Once a season is roughly a month old, I incorporate the adjustments based on the strength of those position groups for the opponents faced.
A quick example is the TE position. Allowing a bunch of points to the Chiefs and Travis Kelce should not be scored equally with allowing a bunch of fantasy points to the Jets and Tyler Conklin. No offense intended toward Conklin, but that is the problem with only looking at raw fantasy points allowed. My adjustment incorporates fantasy points allowed above or below the opponent’s average PPG at that position into the formula. As the season progresses, I also incorporate points over average (POA) allowed over each team’s last three and five games. All of those variables (with varying weights) are where the following SOS ranks come from.
In the chart below, each team’s fantasy SOS for WRs is broken down into three time frames:
- SOS To Date (Weeks 1-9)
- SOS for the Rest of Fantasy Regular Season (ROS) (Weeks 10-14)
- SOS for the Fantasy Playoffs (Weeks 15-17)
In this ranking format, a lower number represents fewer adjusted FPTS allowed per game on average (red color) and therefore a more difficult SOS, and a higher number represents more adjusted FPTS allowed per game (green color), and therefore a fantasy-friendly SOS.
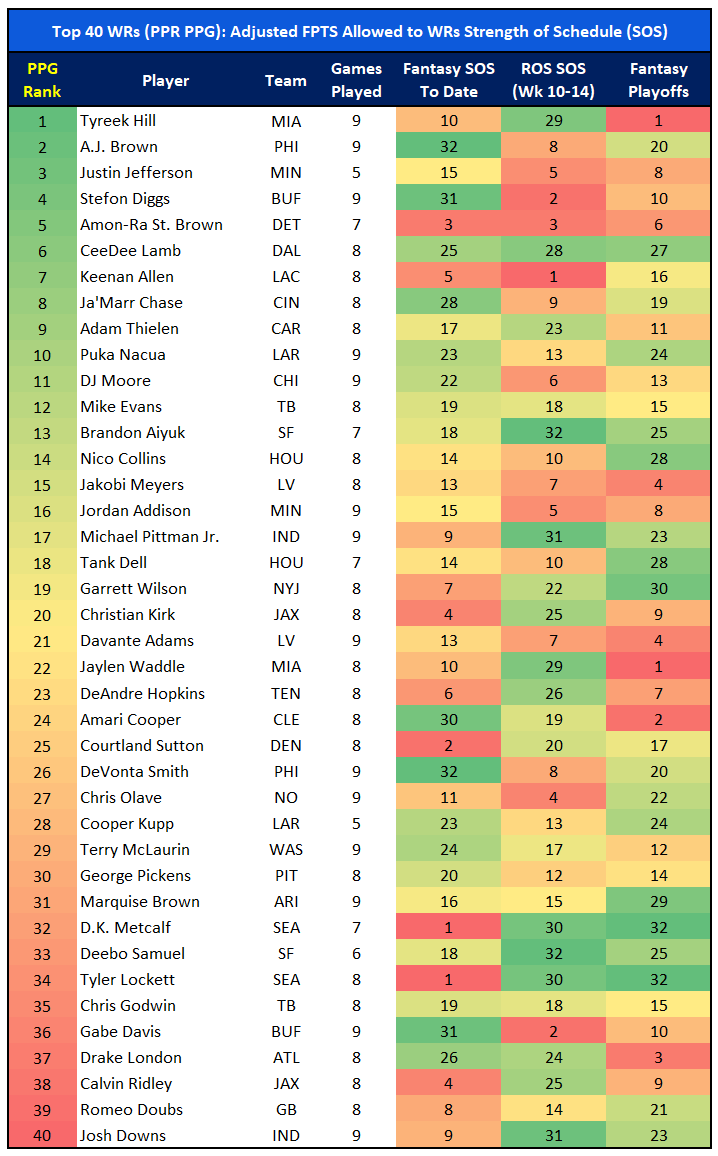
SOS data for WRs is a lot simpler to look at than RBs, because of the RB PFR category I use. With WRs, it’s fairly straightforward. The “to-date” SOS shows which WRs have had more fantasy-friendly schedules so far, and which WRs have faced tough WR opponents (on average). This is one area where my negative outlook on Courtland Sutton gets a bit of a reprieve. Sutton has faced the second-toughest fantasy schedule so far according to my adjusted fantasy points allowed system. And his schedule for both ROS and the Fantasy Playoffs is on the positive side of the scale. However, Sutton’s below-average peripheral metrics still outweigh the boost he might receive due to schedule. He is still a sell, but you can use the schedule forecast as a selling point.
On the flip side, this fantasy schedule data only adds to my optimism for Garrett Wilson. Wilson has faced the seventh-toughest fantasy WR schedule to date, but his ROS schedule ranks 22nd (11th-easiest), and he has one of the best (third-easiest) Fantasy Playoff schedules. Olave’s schedule has been relatively tough, ranking as the 11th-hardest WR fantasy schedule. Olave does have a positive Fantasy Playoff schedule, but you have to make the playoffs first, and his ROS schedule ranks as the fourth-toughest.
The best remaining schedules (meaning highly positive SOS for both ROS and Fantasy Playoffs) belong to the Seahawks, 49ers, Cowboys, Colts, and Jets. The 49ers have the easiest ROS WR schedule and the eighth-easiest Fantasy Playoff schedule. If there is any way for you to buy Brandin Aiyuk you should jump on it. I see a monster second half of the season for Aiyuk. The Seahawks have the most fantasy-friendly playoff schedule and the third-easiest ROS schedule. Looking at both time frames, the Seahawks are at the top of the “best remaining SOS” pecking order. The Colts have the second-easiest ROS schedule followed by the 12th-easiest playoff schedule. You probably cannot buy low on Michael Pittman Jr., but you can with Josh Downs, especially with the recent injury issues he’s had. The Cowboys are also in contention for the best remaining WR schedule. Neither of their time frames is ranked in the 30’s, but their ROS WR schedule ranks as the fifth-easiest and their playoff schedule ranks as the sixth-easiest. There is not much actionable advice with the Cowboys as even their friendly schedule does not inspire confidence in me for Brandon Cooks or Michael Gallup. But if you are lucky enough to roster CeeDee Lamb, just enjoy the ride with Dak Prescott playing some of the best football of his career.
Thanks for reading! If you have any questions about the data used in this article or about fantasy football in general, feel free to hit me up on Twitter.