2023 NFL Strength of Schedule
There are a variety of angles from which to speculate and project the strength of schedule, the most common being the combined winning percentage of a team’s opponents the previous season. This is a simple and widely used method when forecasting the difficulty of future opponents. But you can find that anywhere.
I decided to look a little deeper for this article. The previous season’s opponent winning percentage is part of the equation, but that looks at a historical result. I also wanted to factor in future predictions. I created a strength of schedule scoring system based on the following information:
SOS Scoring System
Historical Information:
- 2023 Opponents’ 2022 Win Percentage
- 2023 Opponents’ Point Differential (2022 points scored minus points against)
Future Predictions:
- 2023 Opponents’ Projected 2023 Win Percentage (based on Vegas odds for team win totals)
- 2023 Opponents’ Pre-Season Power Rankings
I applied a weighting system in the order listed above, with 2023 projected opponent winning percentage receiving the most weight and point differential (2022) receiving the least. The Power Rankings represent an average of 10 sets of rankings from around the industry.
I will start with the Patriots at the most difficult SOS score and go through each team, from hardest to easiest SOS, presenting the following information:
- SOS Score
- 2022 Record
- 2022 Point Differential
- 2023 Projected Wins
- 2023 Pre-Season Power Rank
- 2023 Opponents’ 2022 Win%
- 2023 Opponents’ Projected Win%
You’ll notice right away which division has the toughest schedule in 2023. The four most difficult strengths of schedule belong to the Patriots, Bills, Dolphins, and Jets. The AFC East teams have to play each other, a division with the second-highest projected win percentage at 54.4% and one of only two divisions (AFC North) forecasted to have three of their four teams with winning records (sorry Patriots and Steelers). Here are the projected divisional win percentages:
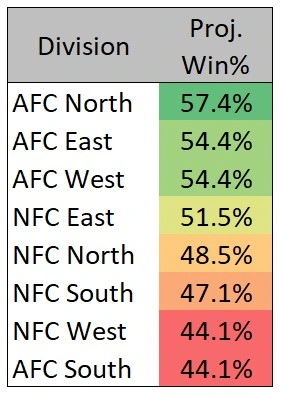
The AFC East also plays non-divisional games versus the AFC West, AFC North, and NFC East, meaning each team plays against some combination of the Chiefs, Eagles, and/or Bengals, which are the only three teams projected to hit 11+ wins according to the Vegas odds.
The easiest strengths of schedule are a cluster of AFC South and NFC South teams, which are two of the bottom-three divisions measured by projected divisional win percentages. The South teams play their divisional games versus each other, and many of their non-divisional games versus the other South, the NFC North, and the NFC West, all being divisions that are projected to be under 0.500.
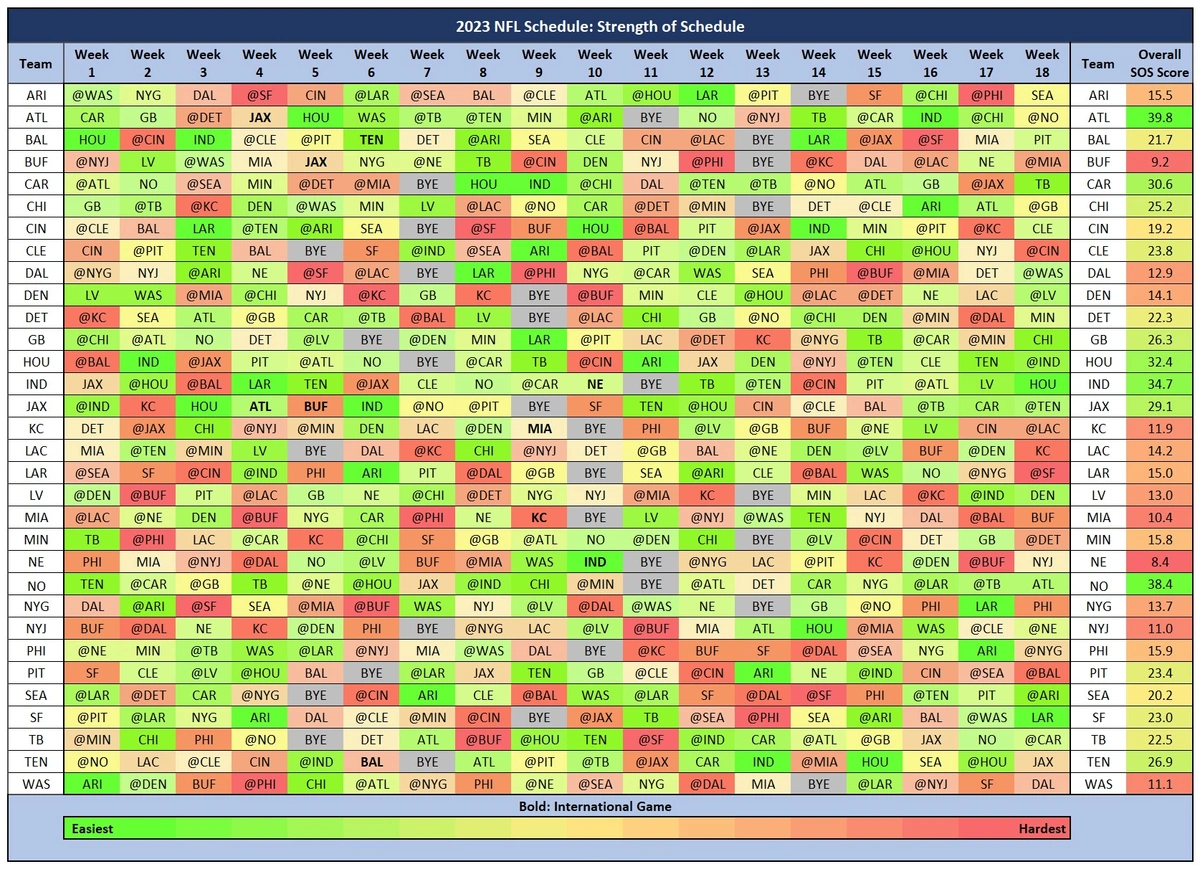
At the conclusion of the article is the full NFL schedule, with each team’s opponents color-coded based on the individual opponent score and showing the SOS scores for each team’s full schedule.

This Article is for Subscribers Only
Become a member at FantasyData and get access to the industry’s best fantasy subscription available and continue reading this article
2023 Strength of Schedule
1 – New England Patriots
- SOS Score: 8.4
- 2022 Record: 8-9
- 2022 Point Differential: +17
- 2023 Projected Wins: 7.5
- 2023 Avg. Pre-Season Power Rank: 20.5
- 2023 Opponents’ 2022 Win%: 54.2%
- 2023 Opponents’ Projected Win%: 53.8%
2 – Buffalo Bills
- SOS Score: 9.2
- 2022 Record: 13-3
- 2022 Point Differential: +169
- 2023 Projected Wins: 10.5
- 2023 Pre-Season Power Rank: 5.0
- 2023 Opponents’ 2022 Win%: 53.8%
- 2023 Opponents’ Projected Win%: 52.8%
3 – Miami Dolphins
- SOS Score: 10.4
- 2022 Record: 9-8
- 2022 Point Differential: -2
- 2023 Projected Wins: 9.5
- 2023 Pre-Season Power Rank: 8.6
- 2023 Opponents’ 2022 Win%: 54.9%
- 2023 Opponents’ Projected Win%: 52.8%
4 – New York Jets
- SOS Score: 11.0
- 2022 Record: 7-10
- 2022 Point Differential: -20
- 2023 Projected Wins: 9.5
- 2023 Pre-Season Power Rank: 9.1
- 2023 Opponents’ 2022 Win%: 53.8%
- 2023 Opponents’ Projected Win%: 52.8%
5 – Washington Commanders
- SOS Score: 11.1
- 2022 Record: 8-8-1
- 2022 Point Differential: -22
- 2023 Projected Wins: 6.5
- 2023 Pre-Season Power Rank: 25.7
- 2023 Opponents’ 2022 Win%: 53.1%
- 2023 Opponents’ Projected Win%: 51.4%
6 – Kansas City Chiefs
- SOS Score: 11.9
- 2022 Record: 14-3
- 2022 Point Differential: +127
- 2023 Projected Wins: 11.5
- 2023 Pre-Season Power Rank: 1.7
- 2023 Opponents’ 2022 Win%: 51.0%
- 2023 Opponents’ Projected Win%: 53.1%
7 – Dallas Cowboys
- SOS Score: 12.9
- 2022 Record: 12-5
- 2022 Point Differential: +125
- 2023 Projected Wins: 9.5
- 2023 Pre-Season Power Rank: 7.4
- 2023 Opponents’ 2022 Win%: 54.2%
- 2023 Opponents’ Projected Win%: 50.0%
8 – Las Vegas Raiders
- SOS Score: 13.0
- 2022 Record: 6-11
- 2022 Point Differential: -23
- 2023 Projected Wins: 7.5
- 2023 Pre-Season Power Rank: 21.9
- 2023 Opponents’ 2022 Win%: 52.1%
- 2023 Opponents’ Projected Win%: 52.4%
9 – New York Giants
- SOS Score: 13.7
- 2022 Record: 9-7-1
- 2022 Point Differential: -6
- 2023 Projected Wins: 7.5
- 2023 Pre-Season Power Rank: 16.7
- 2023 Opponents’ 2022 Win%: 54.5%
- 2023 Opponents’ Projected Win%: 50.7%
10 – Denver Broncos
- SOS Score: 14.1
- 2022 Record: 5-12
- 2022 Point Differential: -72
- 2023 Projected Wins: 8.5
- 2023 Pre-Season Power Rank: 22.3
- 2023 Opponents’ 2022 Win%: 51.4%
- 2023 Opponents’ Projected Win%: 51.7%
11 – Los Angeles Chargers
- SOS Score: 14.2
- 2022 Record: 10-7
- 2022 Point Differential: +7
- 2023 Projected Wins: 9.5
- 2023 Pre-Season Power Rank: 9.4
- 2023 Opponents’ 2022 Win%: 51.7%
- 2023 Opponents’ Projected Win%: 52.4%
12 – Los Angeles Rams
- SOS Score: 15.0
- 2022 Record: 5-12
- 2022 Point Differential: -77
- 2023 Projected Wins: 6.5
- 2023 Pre-Season Power Rank: 25.7
- 2023 Opponents’ 2022 Win%: 52.8%
- 2023 Opponents’ Projected Win%: 50.0%
13 – Arizona Cardinals
- SOS Score: 15.5
- 2022 Record: 4-13
- 2022 Point Differential: -109
- 2023 Projected Wins: 4.5
- 2023 Pre-Season Power Rank: 31.8
- 2023 Opponents’ 2022 Win%: 51.2%
- 2023 Opponents’ Projected Win%: 51.0%
14 – Minnesota Vikings
- SOS Score: 15.8
- 2022 Record: 13-4
- 2022 Point Differential: -3
- More on this ridiculousness later.
- 2023 Projected Wins: 8.5
- 2023 Pre-Season Power Rank: 14.7
- 2023 Opponents’ 2022 Win%: 49.7%
- 2023 Opponents’ Projected Win%: 52.4%
15 – Philadelphia Eagles
- SOS Score: 15.9
- 2022 Record: 14-3
- 2022 Point Differential: +133
- 2023 Projected Wins: 11.5
- 2023 Pre-Season Power Rank: 2.4
- 2023 Opponents’ 2022 Win%: 55.9%
- 2023 Opponents’ Projected Win%: 48.6%
16 – Cincinnati Bengals
- SOS Score: 19.2
- 2022 Record: 12-4
- 2022 Point Differential: +96
- 2023 Projected Wins: 11.5
- 2023 Pre-Season Power Rank: 3.0
- 2023 Opponents’ 2022 Win%: 50.7%
- 2023 Opponents’ Projected Win%: 50.3%
17 – Seattle Seahawks
- SOS Score: 20.2
- 2022 Record: 9-8
- 2022 Point Differential: +6
- 2023 Projected Wins: 8.5
- 2023 Pre-Season Power Rank: 12.5
- 2023 Opponents’ 2022 Win%: 51.4%
- 2023 Opponents’ Projected Win%: 49.0%
18 – Baltimore Ravens
- SOS Score: 21.7
- 2022 Record: 10-7
- 2022 Point Differential: +35
- 2023 Projected Wins: 9.5
- 2023 Pre-Season Power Rank: 7.1
- 2023 Opponents’ 2022 Win%: 47.8%
- 2023 Opponents’ Projected Win%: 51.0%
19 – Detroit Lions
- SOS Score: 22.3
- 2022 Record: 9-8
- 2022 Point Differential: +26
- 2023 Projected Wins: 9.5
- 2023 Pre-Season Power Rank: 12.7
- 2023 Opponents’ 2022 Win%: 49.7%
- 2023 Opponents’ Projected Win%: 49.7%
20 – Tampa Bay Buccaneers
- SOS Score: 22.5
- 2022 Record: 8-9
- 2022 Point Differential: -45
- 2023 Projected Wins: 6.5
- 2023 Pre-Season Power Rank: 28.3
- 2023 Opponents’ 2022 Win%: 47.9%
- 2023 Opponents’ Projected Win%: 50.7%
21 – San Francisco 49ers
- SOS Score: 23.0
- 2022 Record: 13-4
- 2022 Point Differential: +173
- 2023 Projected Wins: 10.5
- 2023 Pre-Season Power Rank: 4.1
- 2023 Opponents’ 2022 Win%: 51.0%
- 2023 Opponents’ Projected Win%: 47.6%
22 – Pittsburgh Steelers
- SOS Score: 23.4
- 2022 Record: 9-8
- 2022 Point Differential: -38
- 2023 Projected Wins: 8.5
- 2023 Pre-Season Power Rank: 17.3
- 2023 Opponents’ 2022 Win%: 46.5%
- 2023 Opponents’ Projected Win%: 49.7%
23 – Cleveland Browns
- SOS Score: 23.8
- 2022 Record: 7-10
- 2022 Point Differential: -20
- 2023 Projected Wins: 9.5
- 2023 Pre-Season Power Rank: 15.7
- 2023 Opponents’ 2022 Win%: 45.5%
- 2023 Opponents’ Projected Win%: 50.0%
24 – Chicago Bears
- SOS Score: 25.2
- 2022 Record: 3-14
- 2022 Point Differential: -137
- 2023 Projected Wins: 7.5
- 2023 Pre-Season Power Rank: 22.8
- 2023 Opponents’ 2022 Win%: 49.5%
- 2023 Opponents’ Projected Win%: 48.6%
25 – Green Bay Packers
- SOS Score: 26.3
- 2022 Record: 8-9
- 2022 Point Differential: -1
- 2023 Projected Wins: 7.5
- 2023 Pre-Season Power Rank: 20.2
- 2023 Opponents’ 2022 Win%: 47.6%
- 2023 Opponents’ Projected Win%: 49.7%
26 – Tennessee Titans
- SOS Score: 26.9
- 2022 Record: 7-10
- 2022 Point Differential: -61
- 2023 Projected Wins: 7.5
- 2023 Pre-Season Power Rank: 25.7
- 2023 Opponents’ 2022 Win%: 44.1%
- 2023 Opponents’ Projected Win%: 49.7%
27 – Jacksonville Jaguars
- SOS Score: 29.1
- 2022 Record: 9-8
- 2022 Point Differential: +54
- 2023 Projected Wins: 9.5
- 2023 Pre-Season Power Rank: 10.6
- 2023 Opponents’ 2022 Win%: 46.9%
- 2023 Opponents’ Projected Win%: 50.0%
28 – Carolina Panthers
- SOS Score: 30.6
- 2022 Record: 7-10
- 2022 Point Differential: -27
- 2023 Projected Wins: 7.5
- 2023 Pre-Season Power Rank: 25.6
- 2023 Opponents’ 2022 Win%: 45.0%
- 2023 Opponents’ Projected Win%: 48.3%
29 – Houston Texans
- SOS Score: 32.4
- 2022 Record: 3-13-1
- 2022 Point Differential: -131
- 2023 Projected Wins: 6.5
- 2023 Pre-Season Power Rank: 29.8
- 2023 Opponents’ 2022 Win%: 42.7%
- 2023 Opponents’ Projected Win%: 48.6%
30 – Indianapolis Colts
- SOS Score: 34.7
- 2022 Record: 4-12-1
- 2022 Point Differential: -138
- 2023 Projected Wins: 6.5
- 2023 Pre-Season Power Rank: 28.3
- 2023 Opponents’ 2022 Win%: 42.9%
- 2023 Opponents’ Projected Win%: 48.3%
31 – New Orleans Saints
- SOS Score: 38.4
- 2022 Record: 7-10
- 2022 Point Differential: -15
- 2023 Projected Wins: 9.5
- 2023 Pre-Season Power Rank: 20.2
- 2023 Opponents’ 2022 Win%: 42.4%
- 2023 Opponents’ Projected Win%: 45.2%
32 – Atlanta Falcons
- SOS Score: 39.8
- 2022 Record: 7-10
- 2022 Point Differential: -21
- 2023 Projected Wins: 8.5
- 2023 Pre-Season Power Rank: 21.9
- 2023 Opponents’ 2022 Win%: 41.2%
- 2023 Opponents’ Projected Win%: 45.2%
Here is the same data for each team in chart form, sorted in the same manner, from toughest to easiest SOS score. In this table I show 2022 wins instead of record for easier comparison to 2023 projected wins.
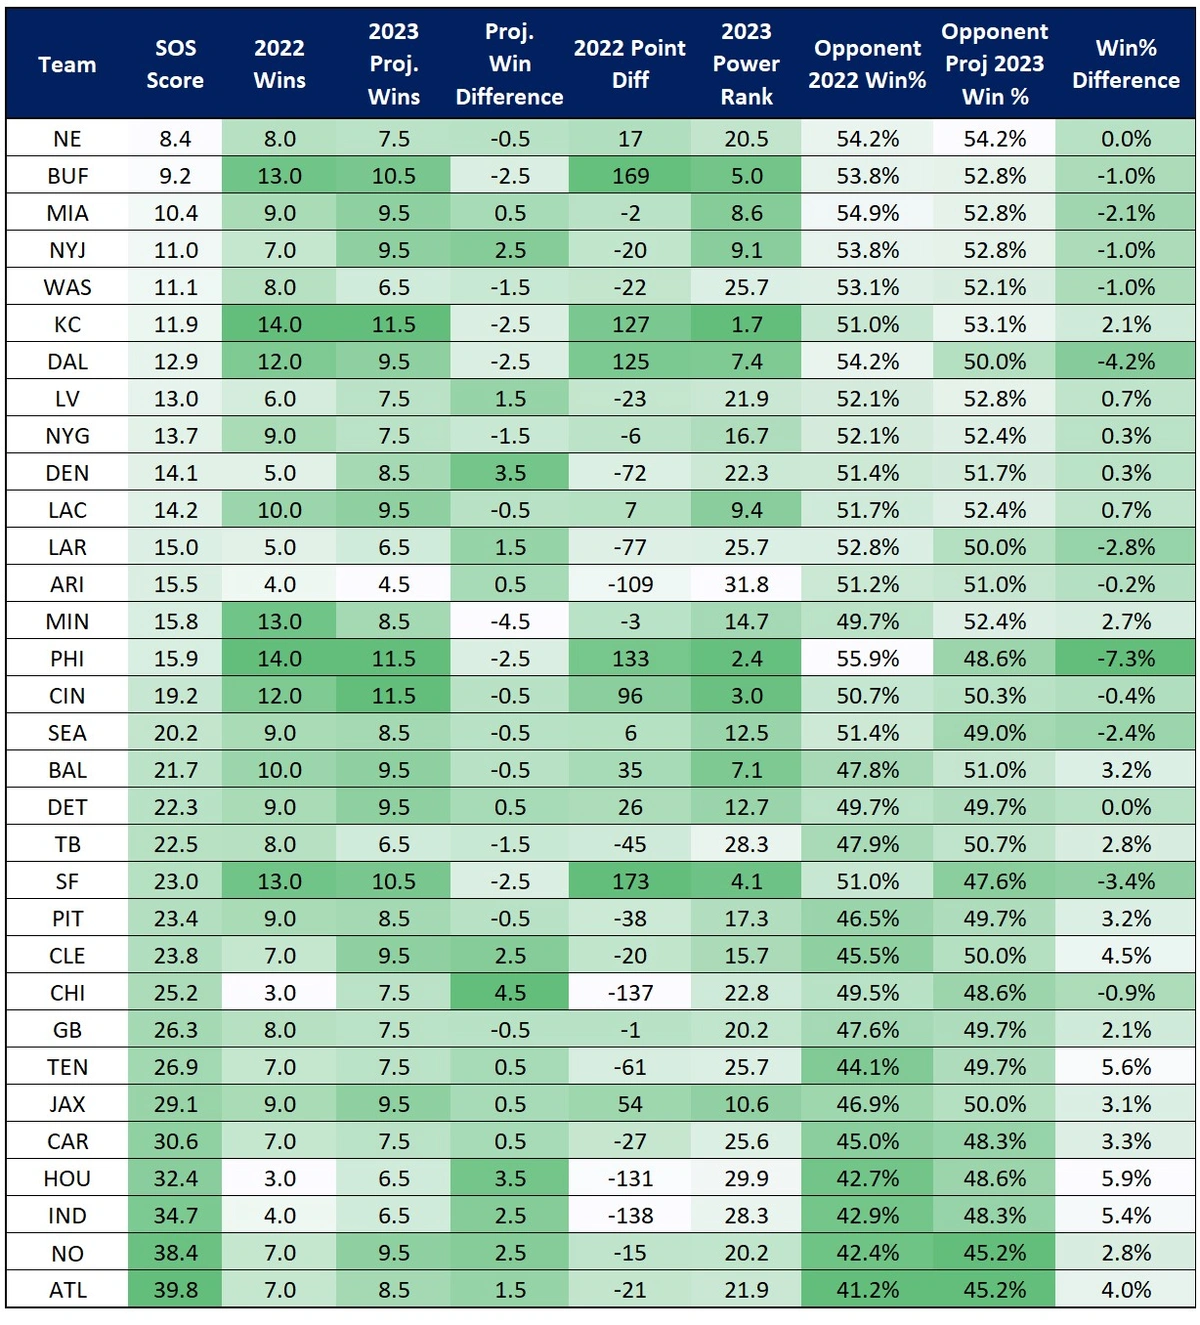
You will notice for some of the teams there are large discrepancies between their opponents’ 2022 win percentage and the same 2023 opponents’ projected 2023 win percentages. And for many teams the difference is minimal. This is due to the actual 2022 wins compared to the projected 2023 wins. The majority of teams have a projected 2023 win total within 1.5 wins of their 2022 record. The following teams are the reason for the more significant discrepancies, with a difference between 2022 wins and 2023 projected wins of at least 2.5 (in both the positive and negative direction):
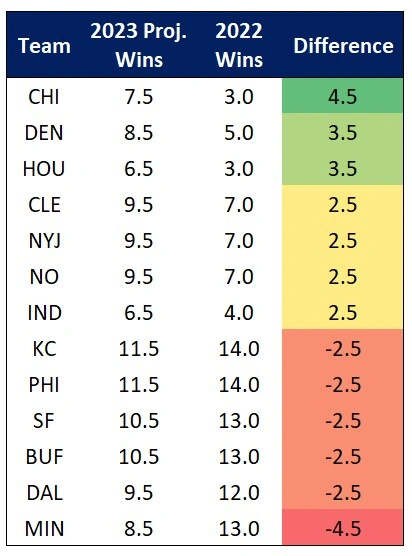
It is normal to see the top teams from a previous season on the negative side of this data. When setting odds such as win totals, where the betting process involves wagering whether the actual number will be over or under the mark, oddsmakers avoid the extremes. The higher they set the number, the probability of the “under” being hit increases. The highest projected win total is 11.5 (which is common), so inevitably, each new season, the teams that smashed will show this negative difference. The odds are not indicating that the Chiefs, Eagles, 49ers, and Bills are worse than last season. On the contrary. The projected wins still show these four teams (and the Bengals) as the top-tier teams in the NFL. The oddsmakers just don’t want to lose a bunch of money by setting the “over/under” win totals too high.
And the same can be said for setting really low numbers. That is the reason you also see these discrepancies with some of the worst teams from 2022. The Texans and Bears each finished with three wins. The only probable direction they can go is up. So, while these two teams look like they are making a major jump based on this positive increase, they are still projected to finish at least one game under 0.500. The Cardinals projected win total of 4.5 is a relatively low number, indicating just how bad pretty much everyone thinks they will be.
The interesting teams here are the Browns, Saints, Jets, and Vikings. The first three are projected to jump by 2.5 wins in 2023. The reason this is more interesting than the Bears and Texans is that projection takes each of these 2022 non-playoff teams to 9.5 wins, smack dab in the middle of contention for at least a Wild Card spot. Will this happen? I have my doubts the Browns will make this jump, and they are in the toughest division in the NFL (measured by projected divisional winning percentages). I do believe the Jets can get there. The AFC East is the second-toughest division, but they made a massive QB upgrade in acquiring Aaron Rodgers, have an infusion of talented youth on both sides of the ball, and have an above-average coaching staff. Upon first glance, the Saints seemed like one of the most obvious “bet the under” teams in the NFL. But looking at their 2023 schedule I wouldn’t be surprised if they got to 10 wins.
Tweeted like 5 minutes too soon. I might have to pull back the Saints bet.
According the Vegas odds, the Saints play only 2 teams all season projected to have a winning record (JAX & DET), and their opponents’ projected win% is 0.452, tied for the lowest with ATL’s schedule https://t.co/wkarFOzWHQ
— Scott Rinear (@MunderDifflinFF) August 4, 2023
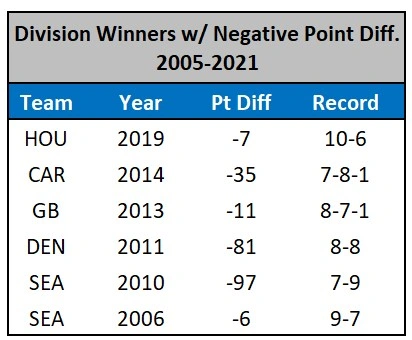
And finally, we have the Vikings. Representing the largest projected 2023 decrease in win total in the NFL, this one cannot be explained in the same way as the top-tier teams discussed above. Somehow, the Vikings won 13 games in 2022. But they were not a 13-win team. You can simply look at their total points differential. Thirteen wins with a point differential of -3. For reference, the other 13-win teams (SF and BUF) had point differentials of +173 and +169, respectively; the two highest in the NFL. The only other division winner with a negative point differential was the Buccaneers, who won their division with an 8-9 record. According to NFL.com, the lowest point differential for a 13-win team since 2005 was the 2019 Packers (+63). And before 2022, there have only been six instances since 2005 of a division-winner having a negative point differential, and a quick look at those teams’ records tells the story:
The Vikings win total is set at 8.5 for 2023, and I would have trouble betting the over on that.
As promised, I’ll leave you with the entire 2023 NFL schedule, with each team’s opponents color-coded based on the SOS score. This allows you to better visualize a team’s projected SOS across each week of the season. The full-season SOS scores are also included for each team, and the teams are sorted in alphabetical order.
Thanks for reading! If you have any questions about the data presented in this article or about fantasy football in general, feel free to hit me up on Twitter @MunderDifflinFF.