
Advanced QB Metrics
Another week of NFL football, another pile of data to sift through looking for clues. Clues as to what leads to certain results and clues for speculating what might be coming next. They say, “Looks can be deceiving.” The same can be said for surface-level statistics in fantasy football. In this weekly article series, I will be looking beneath the statistical surface, beyond the standard box score, using the premium statistics provided by FantasyData, including advanced and efficiency metrics across the fantasy skill positions, to search for puzzle pieces that fit together.
As you have seen if you have kept up on this article series, I like diving into different data sets to search for useful data and trends, but also in an attempt to explain some of the sub-surface metrics; what they mean, and why they are important. While I am always trying to uncover and provide actionable data, this article’s theme doesn’t always lend to short-term actionable information, such as the lineup decisions you are making each week. Last week I dove into fantasy football strength of schedule data across the fantasy skill positions, probably the most actionable article I have written so far for FantasyData. While another week of data has occurred, it has not moved the needle much as far as the remaining fantasy strength of schedule. If you would like to read that article you can find it here.
For this article and much of the rest of the season, I will be moving back to my primary theme and focusing on some of FantasyData’s Advanced and Efficiency metrics now that a good portion of the 2022 season has been played.
NOTE: The data in this article does include the Week 12 Thanksgiving games but does not include the Friday game between the Dolphins and Jets.
QB Advanced and Efficiency Data
I want to spend some time in this article highlighting a few of the advanced/efficiency metrics available at FantasyData starting with the QB position. Some unique statistics add important context to the numbers that show up in the box score:
FantasyData Advanced QB Data:
- Money Throws (Passes requiring exceptional skill or athleticism as well as critical throws executed in clutch moments)
- Accuracy Rating (Grades each pass attempt on a scale from 1 (least accurate) to 10 (most accurate))
- True Passer Rating (Removes dropped passes and throwaways from the passer rating formula)
- Pressured Completion Percentage (Completion percentage when QB is hurried or hit while throwing outside of the pocket)
- Interceptable Passes (Pass attempts within the catch radius of a defender, or deflected into the air in the vicinity of a defender)
I will include additional data in the realm of expectation similar to what I have discussed in recent articles. Additional data courtesy of the weekly database made available by David Wright (@ff_Spaceman):
- Completion Percentage Over Expected (CPOE) (Over or under the “expected” completion percentage based on historical averages factoring in depth of target, opponent strength, down and distance, location on the field, and game script)
- Passing Expected Points Added Per Dropback (EPA/DB) (EPA is a measure of how effectively a team performs compared to expectation on a pass play)
Having spent the last few articles discussing Expected Fantasy Points (xFP) for RBs and WRs, it should not be surprising that I am also interested in the Money Throws metric. Like xFP, Money Throws adds game situation context to traditional box score statistics, and Money Throws also factor in skill. Money Throws (also like xFP), show that not all positive QB plays (e.g. pass completions) are created equal. A 10-yard completion on third and 20 to a wide open check-down option is not the same as a 10-yard completion on third and nine squeezed between two defenders. Both will simply be 10-yard completions in the box score. But, as with most individual metrics, Money Throws are not definitive. Fewer Money Throws do not necessarily correlate to less QB success or fewer fantasy points, and vice versa. Quantifying skill is not as straightforward as quantifying opportunity, efficiency, and production.
There are various places we can look within the numbers in an attempt to identify skill with QBs. Accuracy is one. You can look at a surface-level statistic like overall completion percentage, which is a good starting point, but it also leaves out important context. For instance, dropped passes and intentional throwaways (which are the correct decision more often than not in the NFL) count against the overall passer rating and completion percentage. True Passer Rating and CPOE are more reflective of a QB’s skill level within the measurement of accuracy. Completion percentage metrics are generally helpful, with another FantasyData advanced data point approximately aligning with Money Throws: Pressured Completion Percentage (a QB’s completion percentage while being pressured by the defensive pass rush).
The following chart shows the current Top 24 QBs in points per game (PPG), who are currently their team’s starter and have played in at least five games. I am leaving in a few QBs who are no longer playing (Kirk Cousins, Joe Burrow, Deshaun Watson, and Daniel Jones) because they played enough of the season to where it is useful to include them here and their replacements have not played enough games to include in this data set. This first chart shows accuracy metrics and includes the following data points to help visualize this discussion (sorted by PPG):
- Fantasy Points per Game
- Pass Attempts per Game
- Money Throws per Pass Attempt (Money Throw Rate – MTR)
- Accuracy Rating
- True Passer Rating
- Pressured Completion Percentage/Rate (PCR)
- CPOE
- EPA/DB
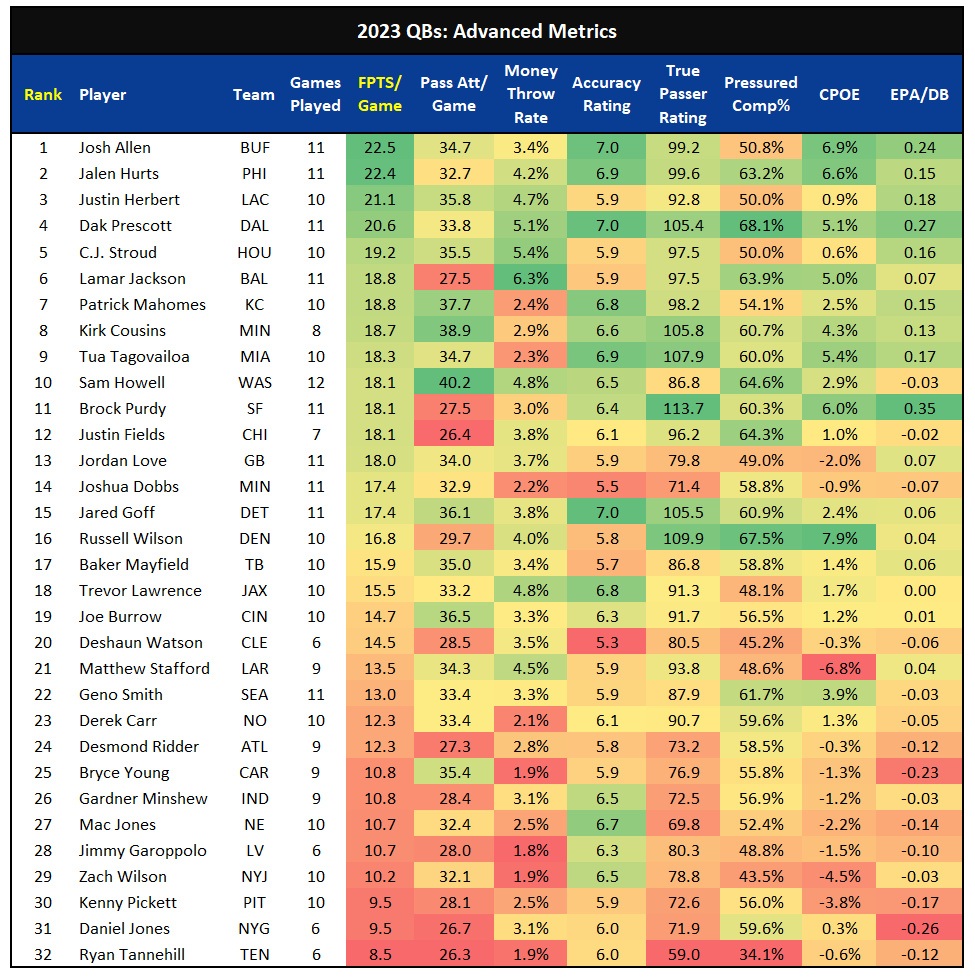
Only looking at fantasy points per game, two names in the Top 5 stand out, mostly because few expected these two QBs to be in the Top 5 this late in the season. After Dak Prescott’s stellar Week 12 performance against the Commanders, he is currently the QB4 in PPG. And C.J. Stroud, who has been a revelation in his rookie season, is currently the QB5. Stroud (and an excellent coaching staff) is the reason the Texans have gone from a 3-13-1 record in 2022 to a 6-4 record and a well-deserved seat in the AFC Playoff race in 2023.
Another QB who stands out with this data is Brock Purdy. Purdy dropped a bit on the PPG leaderboard (currently the QB11) after his Week 12 game against the Seahawks, in which the 49ers did not need a lot from the passing game in a game they controlled from start to finish. That is the main concern with Purdy as a fantasy QB. He has proven (and proven me wrong) that he is a really good NFL QB, but his fantasy output can be limited simply by how good the 49ers team is this season. You can see that risk in his 27.5 pass attempts per game, which is tied for the fifth-lowest per-game average in the league. But, it is with some of these other advanced metrics that Purdy shines. The following chart is consolidated to only show PPG and Money Throw Rate (MTR) and is sorted by MTR from highest to lowest.
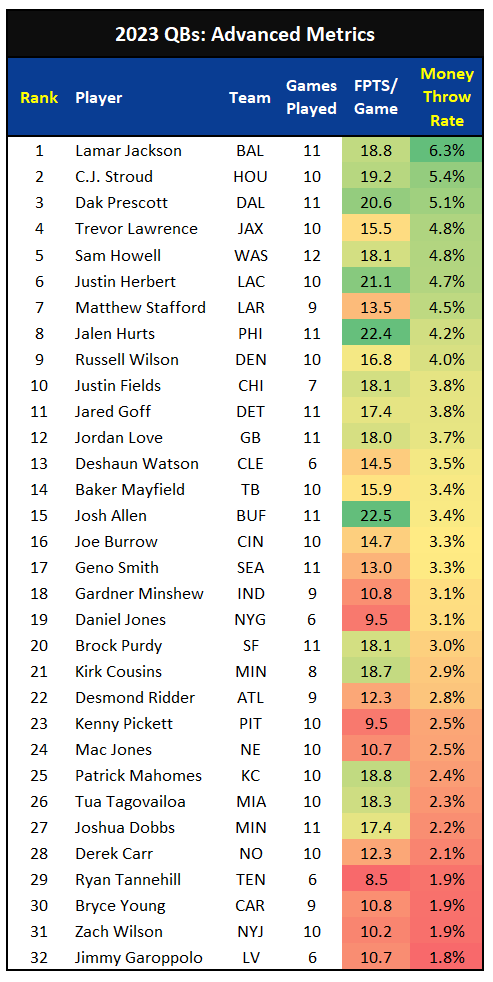
Here is where the two previously mentioned QBs (Prescott and Stroud) also stand out. Stroud is number two on this list with a 5.4% MTR and Prescott is third with a 5.1% MTR. Surprisingly, Lamar Jackson tops the list with a 6.3% MTR, which throws a bit of shade on the last remaining holdouts who think Jackson is a below-average passer in the NFL. All things considered, Commanders’ QB Sam Howell is having an impressive season. He ran into a buzz saw in Dallas on Thanksgiving, but he currently leads the NFL in pass attempts and passing yards. Which is why his fifth-ranked MTR of 4.8% is so impressive. Math does not favor a rate like MTR when the sample size increases. It is similar to yards per carry (YPC) with RBs. An RB can average a higher-than-normal YPC on 100 rush attempts. However, the probability that high YPC can be maintained as the rush attempts increase is low. MTR, just like any other rate, can be skewed by small sample sizes (the denominator in the rate equation). Howell’s sample size (pass attempts) is the highest in the NFL. The kid can play.
It’s only been 9.5 games but we’re at the point with CJ Stroud where we expect him to convert 3rd and longs, to score on a 2 min drill, to lead game winning drives…
Insane 😳pic.twitter.com/EQpTQOwMZC
— Jordan Pun (@Texans_Thoughts) November 19, 2023
Another QB I was surprised to see in the upper reaches of some of these data points is Russell Wilson. I am a Seahawks fan so I know Russell Wilson very well, but I have paid less attention since he was traded to Denver. The groupthink would tell you that Wilson is no longer an effective NFL QB. And he was not a good QB during his first year with the Broncos in 2022. But he has quietly been having a solid season, at least when looking at his peripheral metrics. Wilson is ninth with a 4.0% MTR, but he also has one of the lower PPG of the MTR Top 10 players. Still, Wilson has shown this season that he’s still got it.
QBs with more TD passes than Russell Wilson this season:
Josh Allen
Tua Tagovailoa
<end of list>— Ian Hartitz (@Ihartitz) November 16, 2023
This loops us back to a point I try and be clear with when looking at these metrics. MTR by itself does not correlate strongly with fantasy production, as you can see with some of the other names in the Top 10 in 2023. Patrick Mahomes and Tua Tagovailoa, both with a PPG above 18, are outside the Top 20 in MTR. And Josh Allen, the current QB1 in PPG, has the 15th-highest MTR at 3.4%.
This next chart is consolidated to only show PPG and CPOE and is sorted by CPOE from highest to lowest.
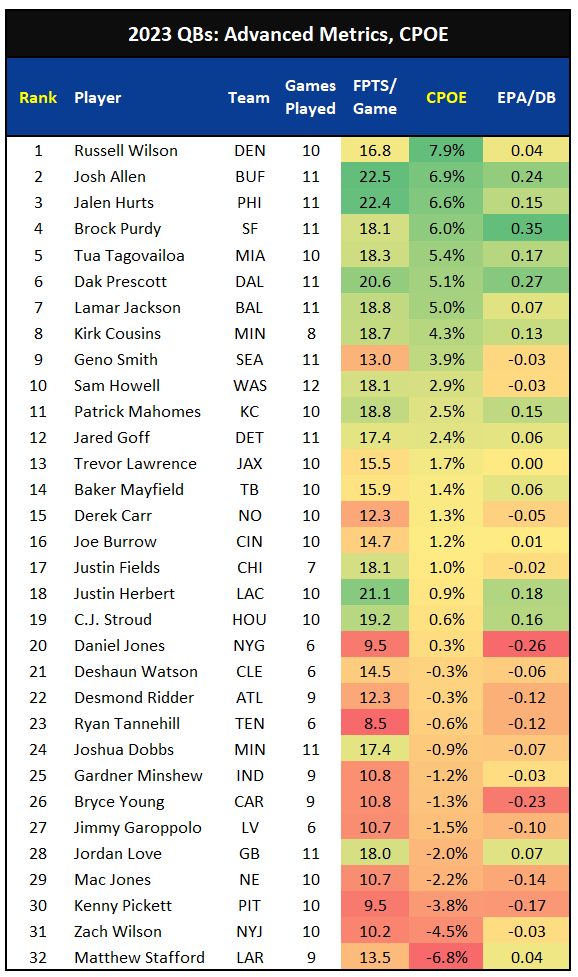
You can see that CPOE is more strongly correlated with fantasy PPG than MTR, with fewer green PPG numbers (higher) outside the Top 10 than with MTR. This still does not mean we can stop with CPOE and call it a day. It is the same deal, the goal is to look at combinations of metrics in an attempt to more accurately convey what has happened and increase our chances of successfully forecasting what is still to come. The leader of this group? The aforementioned Russell Wilson, with a completion rate 7.9% higher than expected. And this is where Brock Purdy returns to excellence, with the fourth-highest CPOE and leading the league in Expected Points Added per Dropback. Now, it should be noted that a better supporting cast is a boon to both CPOE and EPA/DB, and Purdy has arguably the best all-around supporting cast in the NFL with the 49ers’ offense. But that should not be seen as a knock because it still indicates Purdy is exceeding expectations, even what is expected of that elite offense.
This is why most of the QBs near the top of the CPOE and EPA/DB group are part of good offenses. We want our fantasy QBs to be part of good offenses, don’t we? It is similar to when a rebuttal for a good fantasy performance or stretch of good performances is “Well yeah, but look who he has played against.” I spend a lot of time trying to decipher matchup strength for all the fantasy skill positions, and a primary goal with that research and process is to try and set up my fantasy teams (and yours) for success. If I can forecast matchup strength with any semblance of consistency and get players into my starting lineups with favorable matchups, and they smash, that is the whole point of a lot of what I do. Does that mean they will also smash in a negative matchup? Of course not, but I stay away from the absolutism of going directly to an assumption a player will not have success only because their documented success was in a good matchup.
A few QBs in good offenses who are lower on the CPOE list are Trevor Lawrence, Justin Herbert, and C.J. Stroud. Here is where each measures up across some of the metrics discussed so far:
Justin Herbert
- PPG: 21.1 (3rd)
- MTR: 4.7% (6th)
- Accuracy Rating: 5.9 (Tied for 20th)
- True Passer Rating: 92.8 (14th)
- Pressure Completion Rate: 50% (25th)
- CPOE: 0.9% (18th)
- EPA/DB: 0.18 (4th)
You can see that Herbert has been lacking in the accuracy department, but that is the beauty of an elite QB in a good offense like Herbert. He has been able to overcome the accuracy issues and still be a Top 3 QB in PPG. And he has dealth with an abnormally high number of drops by his pass cachers. Imagine if his accuracy improves (and if they move on to a better Head Coach).
If it holds after the initial review, Justin Herbert will be the only active QB since 2020 to have multiple games with his receivers accumulating 6+ drops
— Arjun Menon (@arjunmenon100) November 20, 2023
C.J. Stroud
- PPG: 19.2 (5th)
- MTR: 5.4% (2nd)
- Accuracy Rating: 5.9 (Tied for 20th)
- True Passer Rating: 97.5 (10th)
- Pressure Completion Rate: 50% (25th)
- CPOE: 0.6% (19th)
- EPA/DB: 0.16 (6th)
Looks familiar doesn’t it? Those who have been comparing Stroud to Herbert will like this data set. Stroud doing this in his first season strongly indicates we will be assigned the “elite” adjective to the former Ohio State Buckeye sooner rather than later, with some already accepting it as truth. The sky is the limit for this kid and the Texans got one of the better draft steals in recent memory getting him second overall after Bryce Young.
Trevor Lawrence
- PPG: 15.5 (18th)
- MTR: 4.8% (4th)
- Accuracy Rating: 6.8 (7th)
- True Passer Rating: 91.3 (16th)
- Pressure Completion Rate: 48.1% (29th)
- CPOE: 1.7% (13th)
- EPA/DB: 0.00 (17th)
Lawrence has been more accurate than Herbert or Stroud, but much lower in EPA/DB and the crucial piece, PPG. Lawrence has regressed in 2023. I don’t think anyone would counter that stance. But I am not going as far as some in saying he’s just not as good as we thought. He might not be the generational “Best prospect since Peyton Manning” that followed him into the 2021 NFL Draft. But that probably was not a fair starting point for him (or any QB prospect really). But he is still solid in multiple peripheral metrics.
Trevor Lawrence: NFL’s Best Deep Passer
97.4 PFF Grade, 125.8 NFL Rating
20/39 (51.3%), 539 Yards
6 TDs / 1 INT (17 BTT/ 0 TWP)
pic.twitter.com/4D8tO8HeK4— Daniel Griffis (@DanDGriffis) November 21, 2023
The data point that stands out to me here is his 29th-ranked completion rate when pressured. That is not a good sign. But it also is not a death knell. It is something a QB can improve and is something that can be addressed by strengthening the offensive line and pass blocking. The Jaguars entered Week 12 with the 19th-ranked offensive line according to PFF, an area they should focus on in the offseason and the 2024 NFL Draft.
I have always been a fan of Dak Prescott and I think some of the criticism he has received from many in Cowboys’ Nation and Cowboys’ fans alike has been somewhat unwarranted. A true underdog story coming into the NFL as a fourth-round pick, Prescott has had his struggles, but a disproportionate amount of the blame for the Cowboys not reaching their goals over the past handful of years has been placed directly on Prescott. This is not surprising, as part of the extreme difficulty of playing QB in the NFL is inevitably being the recipient of that blame when things do not go according to plan. But Dak is quieting the haters and naysayers so far this season, and the Cowboys are definitely in the running as a Super Bowl contender. So, I will leave you with this. The same data points for Prescott that I showed for the previous three QBs. In the words of Will Farrell as Mugatu in the movie Zoolander, “Dear God, it’s beautiful!”
Dak Prescott
- PPG: 20.6 (4th)
- MTR: 5.1% (3rd)
- Accuracy Rating: 7.0 (Tied for 1st)
- True Passer Rating: 105.4 (6th)
- Pressure Completion Rate: 68.1% (1st)
- CPOE: 5.1% (6th)
- EPA/DB: 0.27 (2nd)
Dak Prescott had the highest single game grade by a QB since 2007😳 pic.twitter.com/XOxbHMAcZf
— PFF (@PFF) November 24, 2023
Thanks for reading! If you have any questions about the data used in this article or about fantasy football in general, feel free to hit me up on Twitter.