Fantasy Football Beneath the Surface: Advanced WR Statistics
It is said that “looks can be deceiving.” The same can be said for surface-level statistics in fantasy football. During the 2022 NFL season, this weekly article series looked beneath the statistical surface, beyond the standard box score, using the premium statistics provided by FantasyData, including advanced and efficiency metrics across the fantasy skill positions, to search for puzzle pieces that fit together. This is an off-season continuation of the “Beneath the Surface” series, looking at some historical statistical trends and recapping the 2023 season from an advanced stats angle.
For this article, I wanted to revisit some of the WR advanced metrics I wrote about in my debut article for FantasyData last year. I encourage you to read that article as well as it is a good precursor, found here.
In that article, I looked at some useful metrics for wide receivers that showcase two drivers of fantasy production: opportunity and efficiency. The player pool I looked at was the Top 50 fantasy WRs from the 2021 season across the following metrics:
- Target Share
- WR Target Share
- Air Yards Share
- Targets Per Route Run (TPRR)
- Receiving Yards Per Team Pass Attempt (RYTPA)
- Receiver Air Conversion Rate (RACR; receiving yards per air yard)
Rather than re-explaining these metrics, the following is an excerpt from that article summarizing the meaning and benefit of these WR metrics:
“On the surface, volume and production drive fantasy scoring. Receptions, yards, and touchdowns directly produce fantasy points and obviously should not be overlooked or ignored. But they only tell a piece of the story and are relatively less predictive than some other metrics available to us. Many different contexts begin to materialize once you start digging a little deeper.
Wide receiver market share statistics, such as target share, wide receiver target share, target rate (targets per route), receiving yards per team pass attempt (RY/TPA), and air yards share are some of the available metrics that effectively measure a player’s opportunity, with air yards additionally as a good indicator of the level of intent to get the ball in a receiver’s hands. Receiver Air Conversion Ratio (RACR), which measures the number of receiving yards created for every air yard, is a great measure of a player’s efficiency once they’ve earned the opportunity (target) from the QB. RACR is also important because it ties in yards after the catch (YAC). Low air yard players like Chris Godwin and Deebo Samuel will in turn have a low air yard share, but both have a high RACR, which is why you cannot look at something like air yard share by itself.”
Add to that excerpt someone like Chris Olave in 2022, who had the fifth-highest share of his team’s air yards but was 46th out of 50 WRs in RACR. Olave did little after the catch (39th in YAC per reception) but he was targeted deeper down the field, so a higher percentage of his receiving yards came while the football was in the air on its way to him.
So, let’s get after it. I will start by looking back at the individual players for whom I provided analysis based on their 2021 metrics and then look at the results for those WRs from the 2022 season.
Recap: 2021 Advanced WR Metrics
Again, you can read my debut article covering the 2021 Top 50 WRs here. I spotlighted two WRs at opposite ends of the peripherals spectrum measured by 2021 statistics: Mike Evans and DJ Moore.
Mike Evans
I called out Mike Evans because his 2021 PPR finish (WR10) seemed out of place with where he ranked in these advanced statistics in 2021:
- Target share: 16.9% (41st)
- Air yards share: 27.2% (29th)
- TPRR: 20.1% (36th)
- RYTPA: 1.63 (30th)
- RACR: 0.70 (35th)
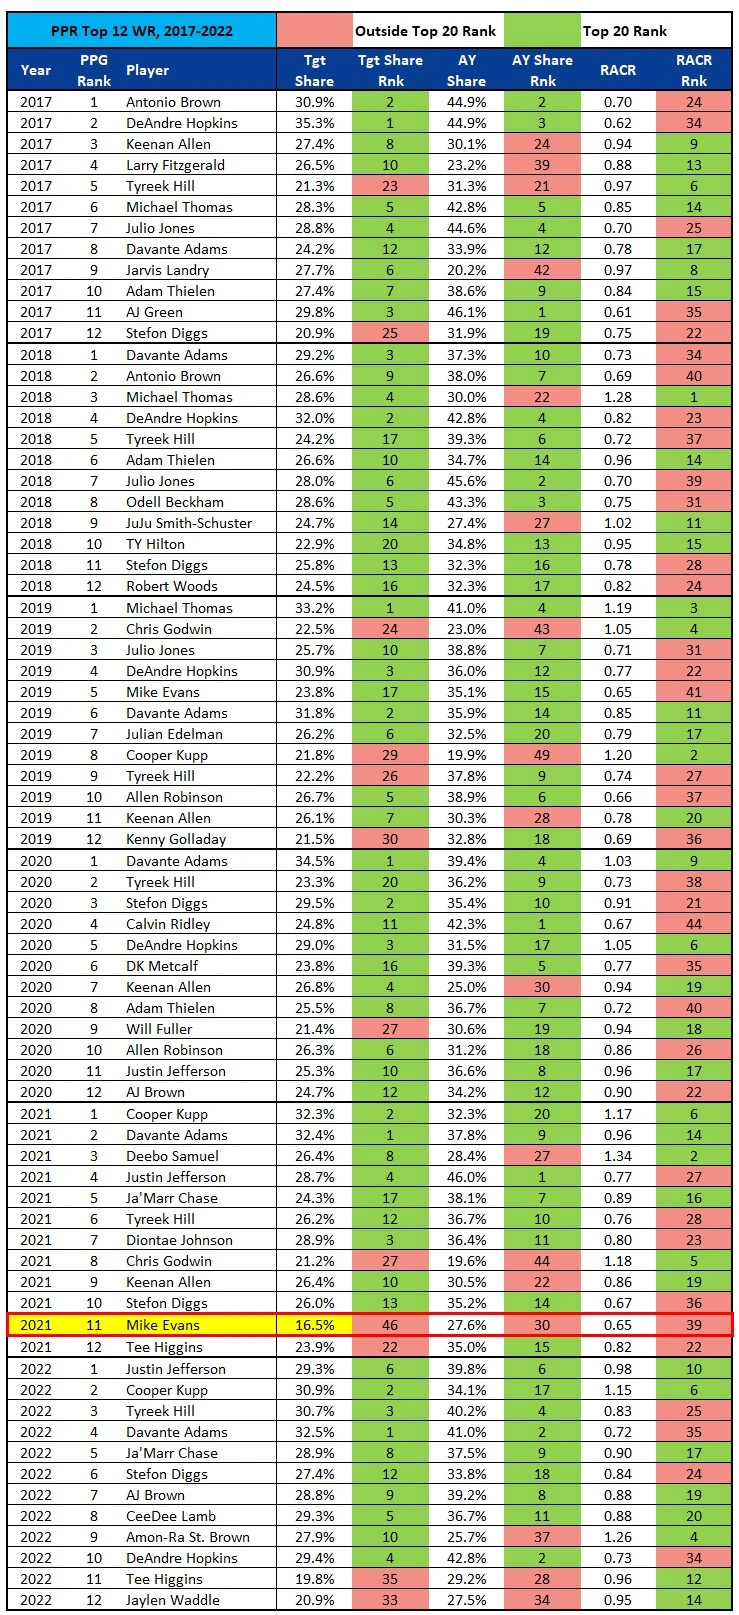
Typically, a Top 12 WR ranks highly in at least one of target share, air yards share, or RACR. Another more general way to put that is a WR1 usually is upper tier in at least one of target/volume hog (e.g. Keenan Allen), a deeper threat (e.g. Chris Olave), or run after the catch maven (e.g. Deebo Samuel). The fact that Evans was not even Top 20 in one of the categories was my concern. Looking at the WR1s (Top 12) from 2017-2022, Evans is the only WR who did not hit the top 20 in any of these three metrics:
A league-leading TD rate (11.2%) was a major contributor to Evans’ WR1 finish in 2021. That was the third-highest TD rate since 2017 (behind only 2020 Adam Thielen at 13.6% and 2020 Davante Adams at 11.9%).
Here was my take on Evans:
“Evans could easily put up another 1,000-yard season and sneak into the top 12 again. Believe me, it’s hard to bet against him. But you also cannot be blinded by his career accolades. Eight straight 1,000-yard seasons is elite, and Evans is extremely talented. But that is not a reason to ignore these numbers, which are pointing at the potential for a downslope. Any downtick in his TDs or the team’s overall passing volume, combined with these 2021 peripherals could mean a relatively disappointing season for Evans in 2022.”
It turns out this concern was valid as I hit this one right on the mark. Evans fell to the PPR WR16 in 2022, with the following ranks across the same metrics listed above:
- Target share: 19.7% (36th)
- Air yards share: 36.4% (13th)
- TPRR: 20.4% (34th)
- RYTPA: 1.67 (30th)
- RACR: 0.68 (40th)
Evans did improve his air yards share, but his TD rate plummeted to 4.7% (27th), to the point his PPR WR16 finish seems high. With Baker Mayfield slated to start at QB for the Buccaneers in 2023, I am even lower on Evans than I was last year. I currently have Evans ranked as the WR26 in PPR redraft format.
DJ Moore
I spotlighted DJ Moore for the opposite trend. Moore finished as the PPR WR22 in 2021 even after putting up these excellent peripherals:
- Target share: 28.3% (4th)
- Air yards share: 40.1% (4th)
- TPRR: 27.8% (9th)
- RYTPA: 2.34 (6th)
- RACR: 0.67 (38th)
Here you see the common yin-yang relationship between air yards and RACR. A higher percentage of receiving yards resulting from YAC drives up RACR, and YAC becomes more difficult the farther down the field a WR is targeted. A WR being top five in both air yards and YAC would likely break fantasy football. Since 2017, a few WRs have come close to accomplishing this feat of finishing top five in air yards share and YAC per reception, and it’s no surprise they are some of the most dominant WRs in recent history:
So, did hyping Moore based on these stellar advanced statistics work out? From a fantasy points standpoint, the answer is no. Moore finished as the PPR WR32 in 2022, a stark reminder that “predictive” does not include any level of certainty when looking at these metrics. But what happened with Moore? Here is where he ranked in the same metrics in 2022:
- Target share: 27.5% (11th)
- Air yards share: 46.1% (1st)
- TPRR: 23.2% (20th)
- RYTPA: 1.99 (16th)
- RACR: 0.62 (48th)
You can see Moore’s target share did decrease slightly, and his TPRR decreased moderately, but he led the NFL in air yards share. Still, WR33 seems very low with those numbers. Moore’s biggest obstacle is not being a sub-par WR, it never has been. It’s mainly due to him being part of sub-par passing offenses with sub-par QBs. In 2022, Carolina was a bottom-tier passing offense:
- Pass attempts per game: 28.1 (29th)
- Passing yards per game: 203.2 (26th)
- QB completion rate: 57.9% (31st)
But Moore remains a wild card when projecting for 2023, as he joined a Bears team that was down there with the Panthers in 2022 passing statistics. I still believe Moore is one of the more talented WRs in the NFL, and I am a believer in Justin Fields. But it would take a seismic increase in passing volume in the Bears’ offense for Moore to start sniffing the Top 15. Currently, I have Moore ranked as the WR23 in PPR redraft format, but I would not be surprised if he outplays that rank as he is the clear-cut number-one passing option in an offense that should have a higher pass rate in 2023.
Justin Fields to DJ Moore. pic.twitter.com/CCzSAb1icB
— Dave (@dave_bfr) July 27, 2023
2022 Advanced WR Metrics
For the 2022 season, I expanded and reorganized the metrics into the following categories:
Market Share
- Target Share
- Air Yards Share
- Weighted Opportunity Rating (WOPR)
- This metric incorporates the value of WR targets based on situation and where the target occurs on the field. For instance, red zone targets are assigned a higher value than targets in one’s own territory. A higher WOPR indicates higher-value targets on average.
- Receiving Yards Share
- Team TD Share
- Snap Share
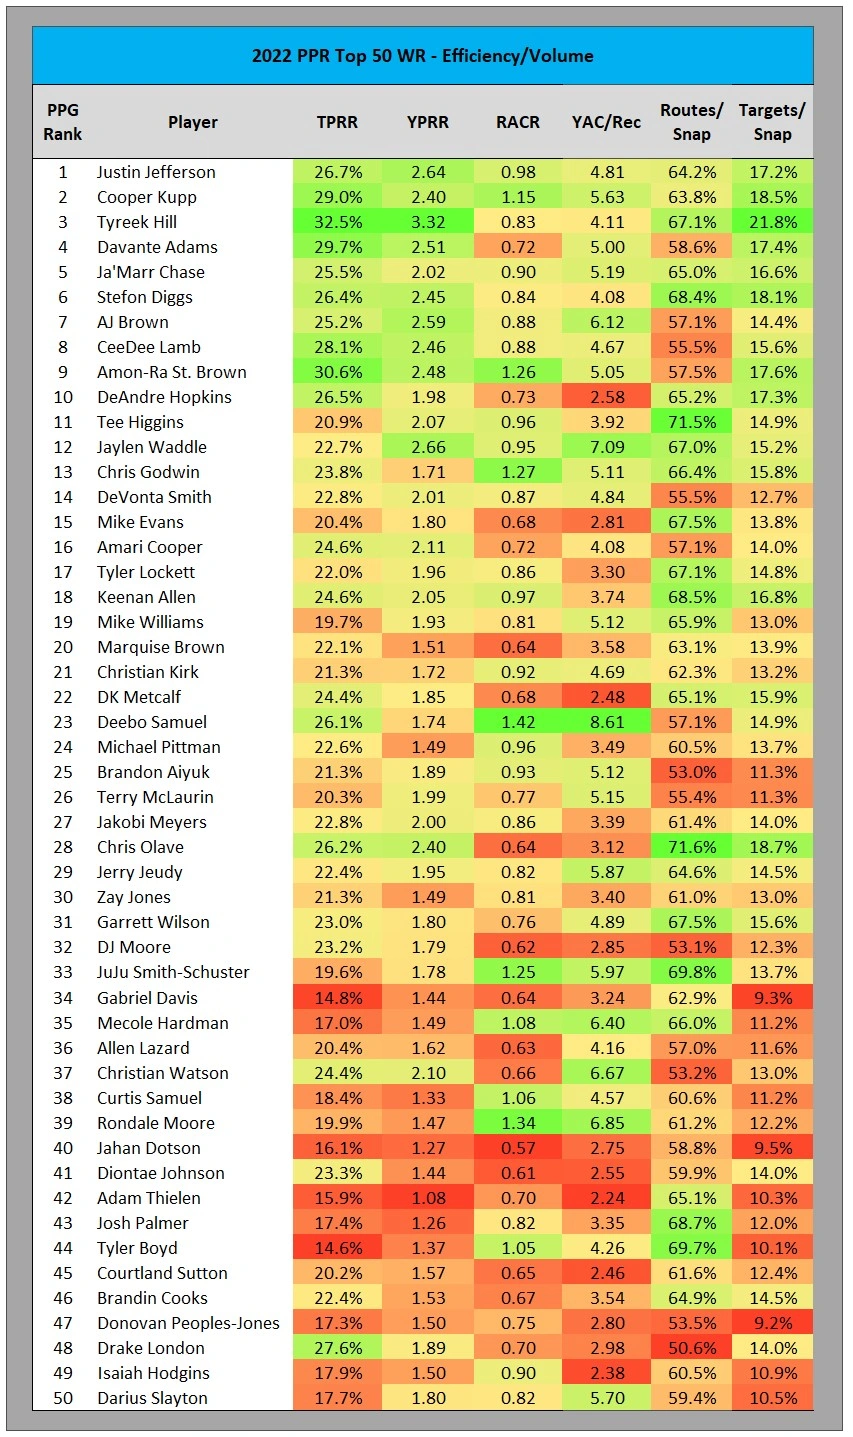
Efficiency/Volume
- Targets Per Route Run (TPRR)
- Yards Per Route Run (YPRR)
- Receiver Air Conversion Rate (RACR; receiving yards per air yard)
- Yards After Catch (YAC) Per Reception
- Routes Per Snap
- Targets Per Snap
The pool of WRs will include the 2022 PPR Top 50 WRs based on the following criteria:
- Points per game
- Minimum eight games played
- Does not include statistics from Week 18
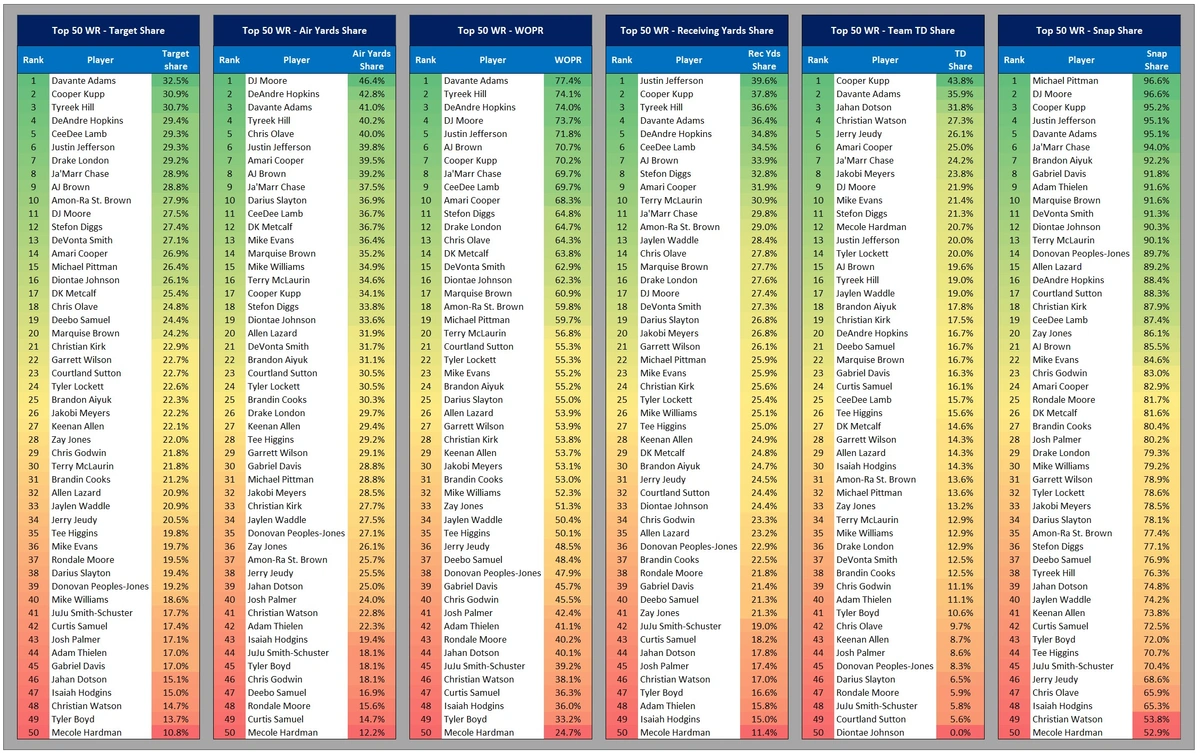
After going through each category with the 2022 Top 50 WRs, I will present different combinations of metrics across categories. I preach that you need to look beyond just one metric to include important context. Certain statistics are relatively predictable by themselves, such as targets share. But you still need to look further. Drake London turned in the highest rookie season target share in at least the last 10 years in 2022 at 29% but finished as the WR48 due to the passing market from which he was sharing being historically low.
2022 WR Market Share
This table shows the Top 50 WRs sorted by where they ranked in the Market Share statistics listed above:
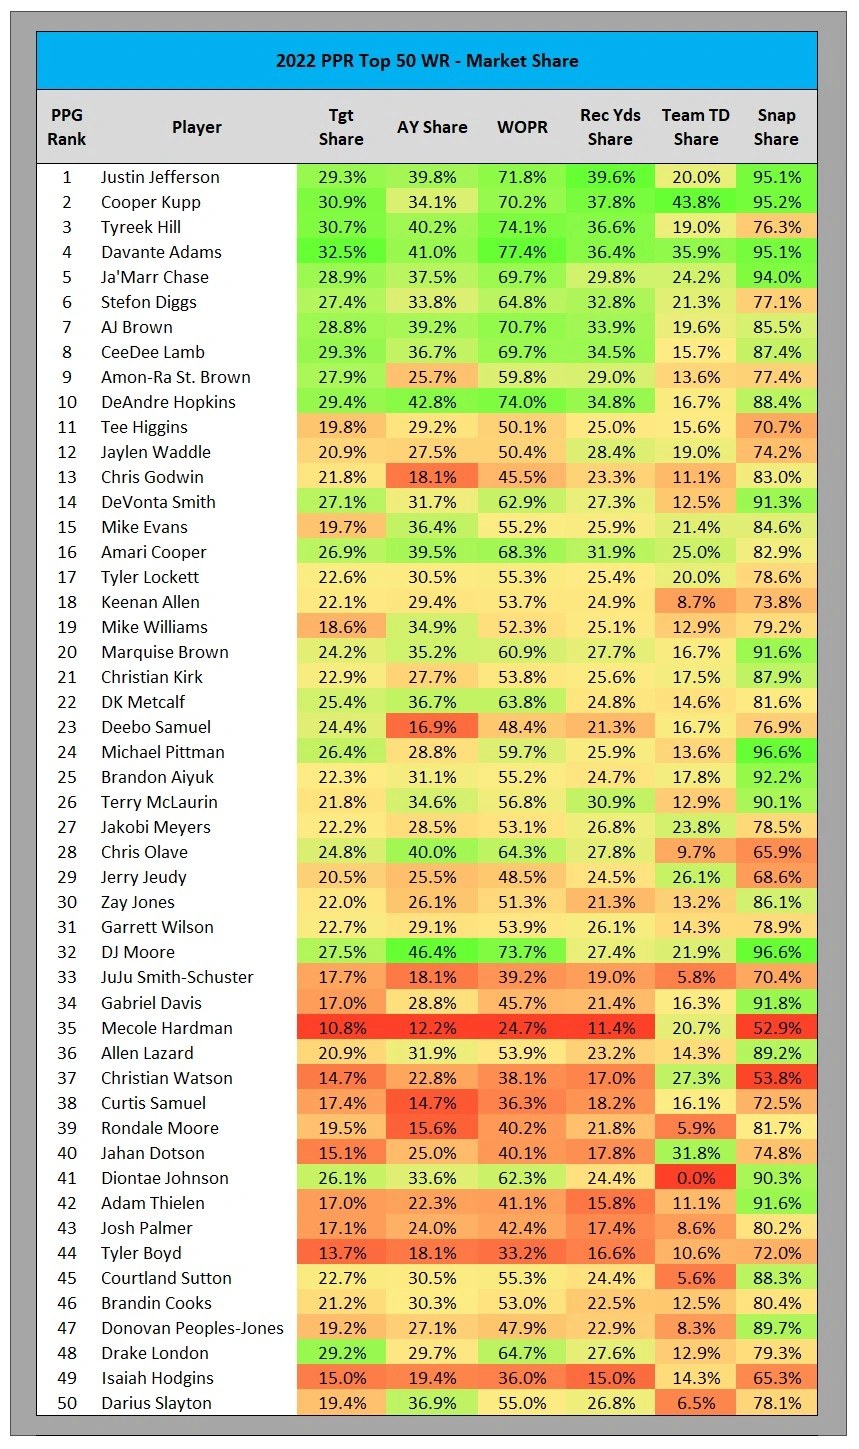
I always like to look at these data sets from multiple angles, so I also reorganized the data with the WRs sorted by PPG rank. This makes it easier to see how each WR did across each market share statistic:
You already know that I am a big fan of conditional formatting and using a color scale to help visualize what this data is telling us. Green is good, the brighter the better. There is not a lot to decipher here for the Top 10 WRs. Each is bright green across the board, which is not rocket science. WRs who dominate their team’s market share relative to other WRs in the league tend to score the most fantasy points. This is why target share is one of the more predictive individual metrics. What I look for in the second table (sorted by PPG) are rows of yellow-to-green color that stand out, showing a WR who put up decent peripherals that did not translate into what I would consider a proportionate level of fantasy points (like DJ Moore in the 2021 data discussed above). I also look for more reddish-colored rows closer to the top (like Mike Evans in 2021).
DeAndre Hopkins
The first name that stands out is DeAndre Hopkins, and he is an important player to discuss after signing with the Titans. He was a bit forgotten about last year, which will happen when players serve suspensions. Coming off his suspension in 2022, Hopkins went on to finish as the WR10 in PPG and put up the following market share numbers:
- Target share: 29.4% (4th)
- Air yards share: 42.8% (2nd)
- WOPR: 74.0% (3rd)
- Receiving yards share: 34.8% (5th)
- TD share: 16.7% (20th)
- Snap share: 88.4% (16th)
Hopkins is 31, which is concerning based on historical WR age trends, and the Titans are not exactly a pass-happy team. But he showed he can still dominate a team’s passing market share and joins a team where he will slide in as the top pass catcher (by far) immediately. Hopkins is risky with the age and injury concerns, but I think he picks up right where he left off last season, and I currently have him ranked as the PPR WR14 in redraft formats.
Deandre Hopkins 1st play of 1v1s
Nuk is going to be just fine in Tennessee pic.twitter.com/xSr6Oi9igQ
— Jake Estes (@dynasty_jake) July 28, 2023
Chris Olave
This is not the last time you’ll see Olave’s name in this article. As a rookie, Olave put up solid market share numbers:
- Target share: 24.8% (18th)
- Air yards share: 40.0% (5th)
- WOPR: 64.3% (13th)
- Receiving yards share: 27.8% (14th)
- TD share: 9.7% (42nd)
- Snap share: 65.9% (47th)
Olave’s TD share and snap share are what limited his fantasy success, but those are two common statistics for which rookie WRs struggle. I project both of these market share statistics to increase in 2023. More on Olave later in the article.
DJ Moore
And here we are again, with DJ Moore being bright green across most market share metrics but finishing at a disproportionate WR32 in PPG. See my analysis of Moore earlier in the article.
Diontae Johnson
Everyone and their dog know at this point that Johnson scored zero TDs in 2022. His 0.0% TD share is the reddest of red in the table. I will refrain from diving down the TD regression rabbit hole in this article. I did that in a previous article that you can read here (it’s a good article, you should read it). Instead I think it’s safe to assume Johnson will score more TDs in 2023. Ignoring that fact for a moment, you see that Johnson was solid across most of the other statistics, finishing in the Top 20 other than receiving yards share:
- Target share: 26.1% (16th)
- Air yards share: 33.6% (20th)
- WOPR: 62.3% (16th)
- Receiving yards share: 24.4% (33rd)
- TD share: 0.0% (50th)
- Snap share: 90.3% (12th)
None of these numbers are earth-shattering but that is not the point and should not be the expectation with Johnson. However, based on the market share numbers, his WR41 finish also should not be the expectation. Kenny Pickett is a serviceable starting QB and should improve in 2023. I am not here to stan Diontae Johnson as a potential league-winning WR1. But I think the Diontae Johnson fading has gone too far, although his Average Draft Position (ADP) at FantasyPros has crept back up to PPR WR31. I have him ranked as the WR29 in PPR redraft.
Chris Godwin
There are not many “red at the top” WRs in the 2022 market share data, or at least none who stand out as much as Mike Evans did last year. But we’ll stay in Tampa Bay to talk about Chris Godwin. It should be noted, Godwin’s strengths will be more visible in the WR efficiency data, but his overall market share numbers give me pause in my projection for his 2023 fantasy numbers. When healthy, Godwin has been a high-end WR2-low end WR1 throughout his career, but I don’t see that being the case in 2023. Here were Godwin’s market share numbers in 2022:
- Target share: 21.8% (29th)
- Air yards share: 18.1% (46th)
- Remember, this by itself is not a huge knock, as Godwin thrives on shorter targets and YAC
- WOPR: 45.5% (40th)
- Receiving yards share: 23.3% (34th)
- TD share: 11.1% (39th)
- Snap share: 83.0% (23rd)
Godwin’s finish as the PPR WR13 in 2022 is disproportionate in the opposite direction based on these numbers, even if you remove air yards share. And he put up these numbers with Tom Brady at QB. I currently have Godwin ranked as the PPR WR16, and that might be too high with Baker Mayfield at QB.
2022 WR Efficiency/Volume
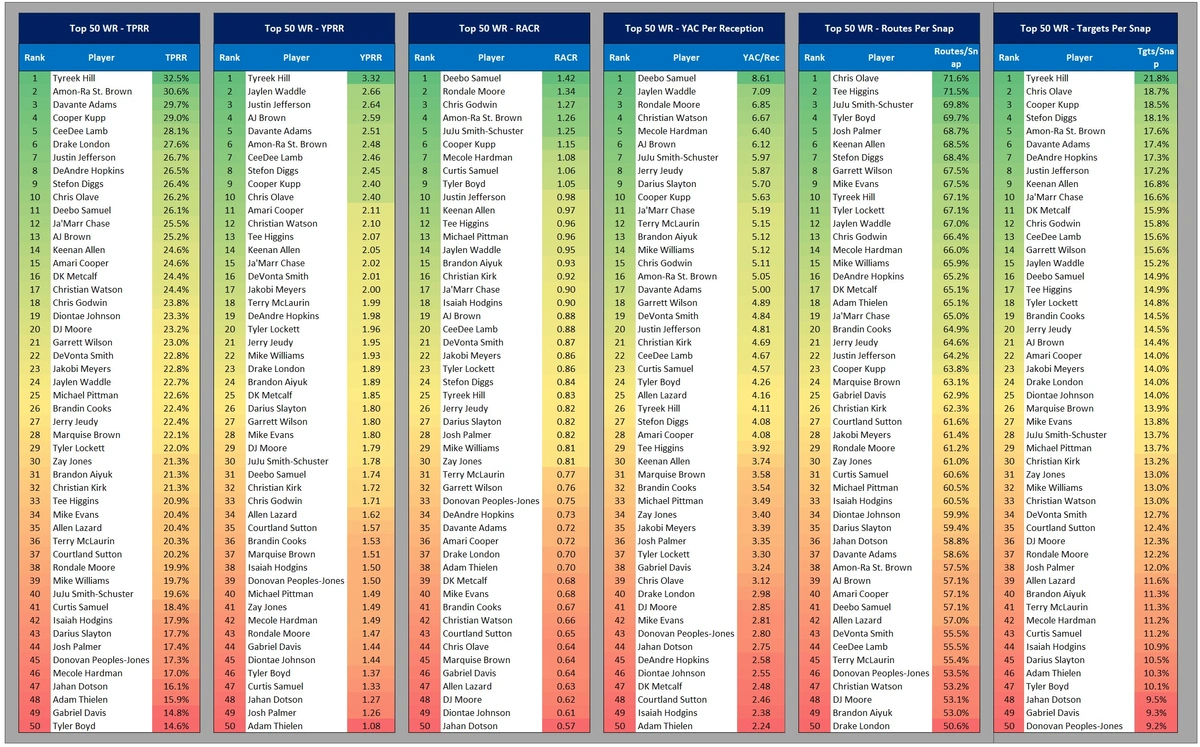
This table shows the Top 50 WRs sorted by where they ranked in the Efficiency/Volume statistics listed above:
Here is the same data set reorganized with the WRs sorted by PPG rank:
Notable WRs in this data set:
Amon-Ra St. Brown
- TPRR: 30.6% (2nd)
- YPRR: 2.48 (6th)
- RACR: 1.26 (4th)
- YAC/Reception: 5.05 (16th)
- Routes per snap: 57.5% (38th)
- Targets per snap: 17.6% (5th)
Chris Olave (Part 2)
- TPRR: 26.2% (10th)
- YPRR: 2.40 (10th)
- RACR: 0.64 (44th)
- YAC/Reception: 3.12 (39th)
- Routes per snap: 71.6% (1st)
- Targets per snap: 18.7% (2nd)
Deebo Samuel
- TPRR: 26.1% (11th)
- YPRR: 1.74 (31st)
- RACR: 1.42 (1st)
- YAC/Reception: 8.61 (1st)
- Routes per snap: 57.1% (41st)
- Targets per snap: 14.9% (16th)
And for those of you still thinking this WR is going to be fantasy relevant:
Donovan Peoples-Jones
- TPRR: 17.3% (45th)
- YPRR: 1.50 (39th)
- RACR: 0.75 (33rd)
- YAC/Reception: 2.80 (43rd)
- Routes per snap: 53.5% (46th)
- Targets per snap: 9.2% (50th)
2022 WR Combined Metrics
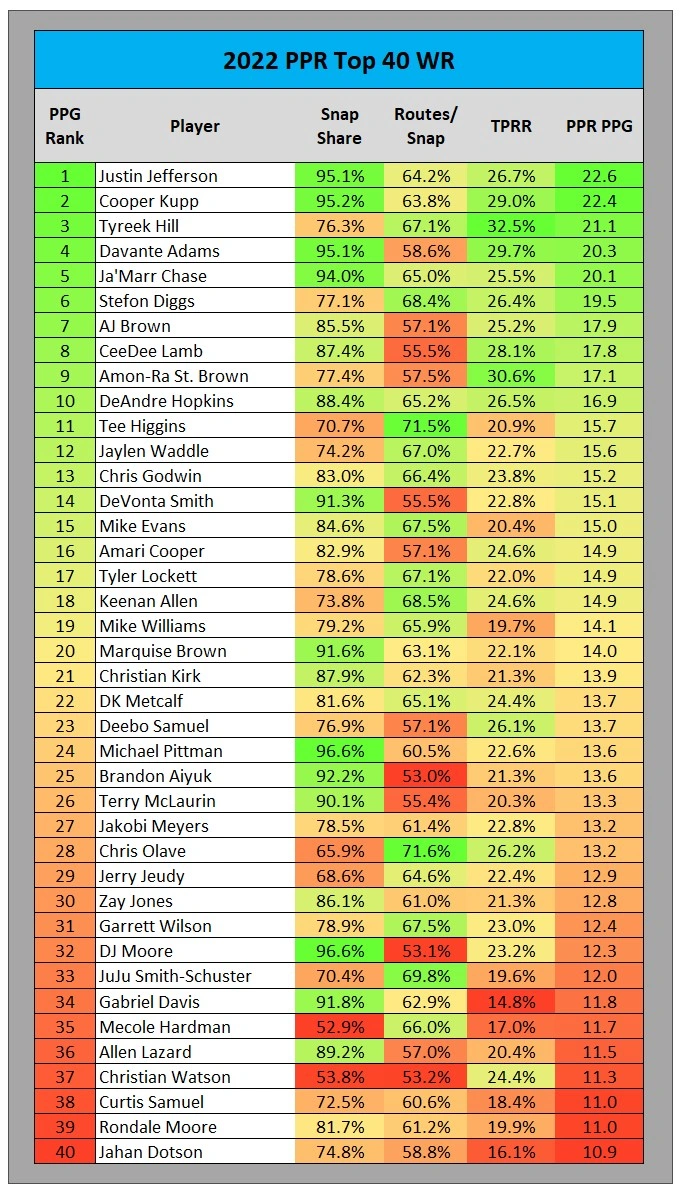
For this data set, I shortened the player pool to the 2022 Top 40 WRs. WRs are sorted by PPG rank, and the following statistics are shown:
- Snap share
- Routes per snap
- Targets per route run (TPRR)
- PPR PPG
How often is the WR on the field (snap share)? When on the field, how often are they running routes (routes per snap)? And when running routes, how often are they targeted (TPRR)? This combination of questions is relatively simple but tells an important part of the story. One angle from which I read this data is fairly straightforward. Red numbers across the board are not good, and you see that reflected at the bottom of the Top 40 (although I am still bullish on Jahan Dotson). On the flip side, only Justin Jefferson, Cooper Kupp, and DeAndre Hopkins are green(ish) across all three statistics. The majority of the WRs are a mixture of green-yellow-red. So, what combinations within that group are promising, and which are literal red flags? For me, TPRR is the ringleader here and the most predictive of WR talent because targets are earned. Yes, snaps are also earned, but it’s more difficult to earn a target once on the field than it is to simply be on the field. Routes per snap are largely based on the team’s play calling, so in this zoomed-in data set it represents the WR’s opportunity.
If a WR is going to be solid (yellowish) to excellent (greenish) in only one or two of these stats, TPRR needs to be involved.
Chris Olave (Part 3)
Here is why I’m so high on Olave. We’ve already seen his relative prowess with market share. Bright green in routes per snap (league-leading 71.6%), Olave is also greenish in TPRR (26.1%; 10th). The only category keeping him out of the elite “triple-green” company is snap share, which can fluctuate year over year more significantly than routes per snap or TPRR and has a good chance of increasing for Olave with a year of NFL experience under his belt.
I could watch Chris Olave operate all day long pic.twitter.com/AMpVc0VsX9
— Daniel Harms🏈 (@InHarmsWay19) July 22, 2023
Christian Watson
Watson is an example of a WR who excelled in only one of the three categories but did so in the right one (TPRR). A common knock on Watson’s second-half explosion in 2022 is that he relied on some big and broken plays along with an unsustainable number of TDs. And yes, a few big plays can skew a stat like YPRR, especially with a smaller sample size like Watson’s. But neither of those can be used against his 24.4% TPRR, which was the 17th highest rate. Not necessarily stellar, but promising. And Watson’s second-lowest season-long snap share is misleading. Watson started taking off in Week 10. In the six games Watson played from Weeks 1-9, his snap share was 30.7%. From Week 10 on, that jumped to 77.5%. The jury is still out on Jordan Love, but Watson will have every chance to show us if he can be a dominant WR in the NFL as the likely WR1 for the Packers. I currently have Watson ranked as the WR36 in PPR redraft, but that could tick upward between now and September.
Top Rookie WR Seasons by YPRR
+ min. 200 routes run, since 20101 Odell Beckham Jr., 2014 (2.75)
2 A.J. Brown, 2019 (2.67)
3 Justin Jefferson, 2020 (2.66)
4 Ja’Marr Chase, 2021 (2.51)
5 CHRIS OLAVE, 2022 (2.42)
6 Tyreek Hill, 2016 (2.28)
7 CHRISTIAN WATSON, 2022 (2.26)— Scott Barrett (@ScottBarrettDFB) July 22, 2023
Gabriel Davis
Davis is an example of the “not promising” combination of these statistics. Davis had the eighth-highest snap share at 91.8% and a mid-range routes per snap at 62.9% (25th). So, Davis was on the field a lot and running a good number of routes while there. But his TPRR was only 14.8%, ranking 49th out of 50 WR. Maybe he was playing hurt, but it wasn’t much better in 2021 (17.0%) and was lower in 2020 (12.8%). A WR’s TPRR doesn’t significantly fluctuate year over year. The odds are low that Davis will suddenly become even a 20%+ TPRR WR, which would still put him outside the Top 30 in that metric.
This data set is a big reason why I don’t think Davis will ever live up to the hype some have assigned to him. Without a barrage of TDs, I see WR3 as Davis’s ceiling and currently have him ranked as the WR52 in PPR redraft.
Thanks for reading! If you have any questions about the data presented in this article or about fantasy football in general, feel free to hit me up on Twitter @MunderDifflinFF.

