Beneath the Surface Week 12
Another week of NFL football, another pile of data to sift through looking for clues. Clues as to what leads to certain results and clues for speculating what might be coming next. They say, “looks can be deceiving.” The same can be said for surface-level statistics in fantasy football. In this weekly article series, I will be looking beneath the statistical surface, beyond the standard box score, using the premium statistics provided by FantasyData, including advanced and efficiency metrics across the fantasy skill positions, to search for puzzle pieces that fit together.
Here we are. Week 12 of the NFL season. A week with three Thursday games as is tradition on Thanksgiving. And largely due to that tradition, a week with no byes wedged in between a six-bye and two-bye week. This will be a turning point week across many leagues. With the majority of fantasy playoffs starting in Week 15, leaving only two regular season games after Week 12, there will be a lot of playoff spot clinching this week, as well as playoff eliminations.
Top 30 QBs: Advanced Fantasy Points Data
In what has turned into a sub-series within my overall “Beneath the Surface” series, I have been jumping to the end of the story and looking at fantasy points scored. Specifically, I’ve been focusing on fantasy points per game, Expected Points (EP) per game, Fantasy Points Over Expected (FPOE), and fantasy strength of schedule (SOS) based on adjusted fantasy points allowed rankings. My previous two articles covered the Top 36 RBs and Top 36 WRs, both according to PPR format on a PPG basis.
In this article, I will be looking at the Top 30 QBs. This Top 30 group is based on a minimum of four games played and does not include results from the Week 12 Thanksgiving games.
Data used in this article comes from the following sources:
- FantasyData
- Pro Football Reference
- Player Profiler
- Weekly database provided by David Wright (@ff_spaceman on Twitter)
Expected Points for individual players factor in specific context that attaches varying degrees of value to each opportunity (pass attempts and rush attempts). The idea behind EP and FPOE is that not all opportunities are the same. Some opportunities are more valuable than others. For example, a QB who throws five red zone passes would be more appealing than a QB who throws five passes in their own territory. The box score will only show the five pass attempts for both players, but the Expected Points would be higher for the QB in the red zone. A red zone pass attempt is given a higher value than a pass attempt between the 20s because of the increased odds of that play resulting in a TD. Whereas RBs and WRs have a higher average EP through the air (versus rushing), the opposite is true for QBs. A higher expected points value is attached to QB rushes than to QB pass attempts. The general QB EP recipe is slightly different than RBs and WRs:
- Value of rush attempts vs pass attempts
- Down and distance
- Yard line
- Depth of target (QB aDOT, or Air Yards per target)
With EP you can calculate FPOE, which shows the players who are underperforming or overperforming in PPG compared to what is expected. Marvin Elequin (@FF_MarvinE on Twitter) with The Fantasy Footballers wrote a great series last offseason explaining EP (which he abbreviates as “xFP”) and FPOE. Marvin’s article covering QBs can be found here. Marvin goes into much more detail about the quantitative values of the QB Expected Points, showing the increase as the yard line gets close to zero (opponent’s end zone) as well as the average numerical value of QB opportunities.
For the charts in this article, the column by which the data is sorted will have a yellow-highlighted column title.
Top 30 QBs: Fantasy Points, Expected Points, FPOE
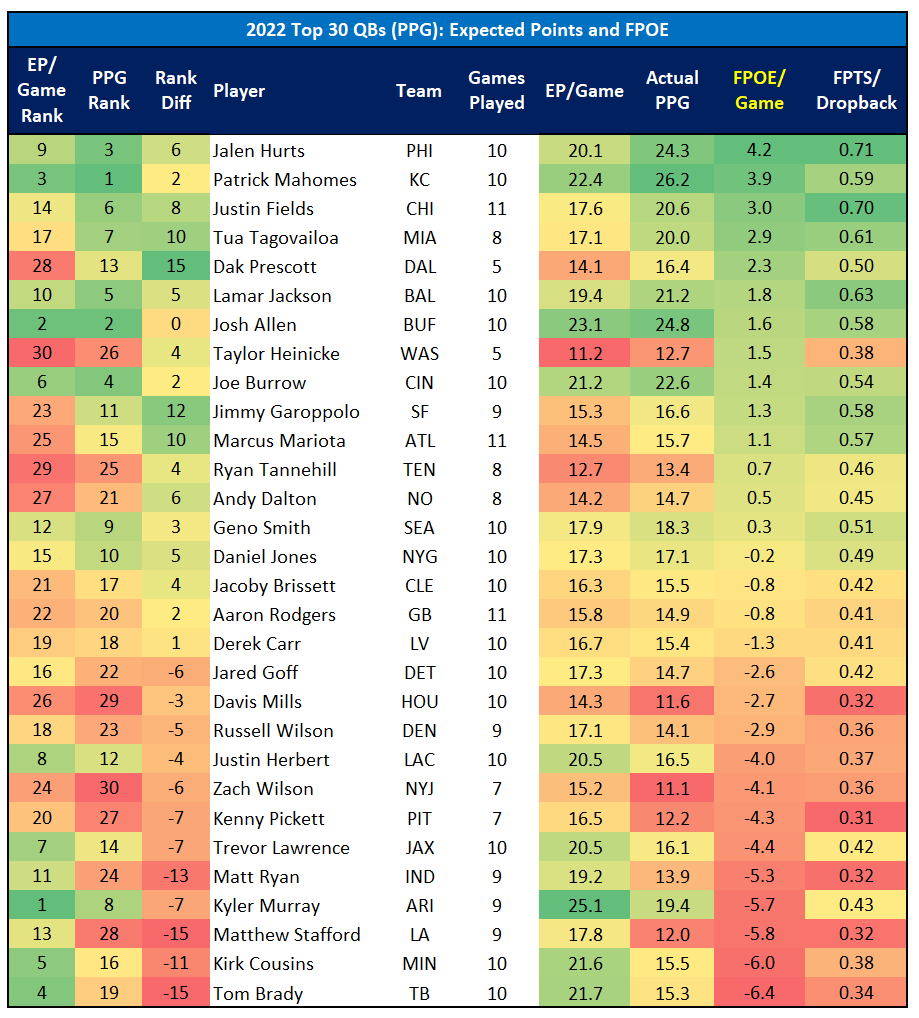
The first chart is sorted by FPOE from highest to lowest.
Lamar Jackson
I want to start with Lamar Jackson because there are some interesting takeaways in this data for the Ravens’ QB. Jackson is the overall QB5 on the season in PPG. Upon first glance, this seems high considering Jackson has been one of the more disappointing fantasy QBs for weeks. And looking at EP, it is a bit high, with Jackson sitting at QB10 in EP rank. Averaging 1.8 positive FPOE per game, Jackson is five spots higher in actual PPG. According to FantasyData, Jackson’s season-long PPG is 21.2. However, he has only exceeded that average once since Week 4 (seven games). Since Week 4, Jackson has averaged 16.4 PPG, making him the QB15 in that time frame. So why does he have a positive FPOE? The answer is fairly simple.
Jackson’s performance in the first three weeks of the season was ridiculous. He was the overall QB1 in PPG by a lot with 34.8 PPG. In Weeks 2 and 3, Jackson scored 42.6 and 39.4 fantasy points. Both Rashod Bateman and Mark Andrews were healthy, and Jackson averaged the following per game in Weeks 1-3:
- 8.7 rush attempts
- 81.0 rushing yards
- 9.3 yards per rush
- 0.67 rushing TDs
- 249.7 passing yards
- 3.3 passing TDs
Per game since Week 3?
- 10.1 rush attempts
- 60.4 rushing yards
- 6.0 yards per rush
- 0.14 rushing TDs (only one rushing TD in his last seven games)
- 175.4 passing yards
- 0.86 passing TDs
Jackson’s positive FPOE is still being elevated by his astronomical numbers Week 1-3, during which Jackson averaged 12.3 FPOE per game.
From Week 4 through Week 9, Jackson’s average FPOE per game was -3.4. So you can see how significantly those first three weeks are impacting Jackson’s season-long numbers. Now, I don’t think this version of Jackson remains the case. Moving back up to 35 fantasy points per game is not likely but I don’t think staying at 16.4 PPG is likely either. Compared to the first three weeks, the Ravens have been in lower scoring, fewer plays-style games against more “grudge match” type opponents and their defense has improved. Two of their first three games saw total points scored above 60. Since then the highest combined points scored was 49 points versus Tampa Bay in Week 8. Fewer plays and lower scores with no shoot-outs drive both EP and actual fantasy points down. Jackson’s completion rate in both sets of games (Week 1-3 versus Week 4-11) is right around 63%, his interception rate was 2.3% and 2.5%, and he has only lost one fumble all season. Jackson’s career yards per rush attempt is 6.1, so he’s been right at his career average during this seven-game stretch. The Ravens are 5-2 since Week 3 and have won four in a row. Jackson has not been playing poorly. He has just been in game situations with far less EP and therefore fewer actual fantasy points available.
I do think Jackson returns to his fantasy points-scoring form starting this week and will climb back above 20 PPG moving forward. The Ravens have faced the third-toughest schedule so far in adjusted fantasy points allowed to QBs. But they have the ninth-easiest rest of season and eighth-easiest Fantasy Playoff QB schedule. The Ravens have also faced the sixth-toughest fantasy schedule for RBs. QB rushing and RB rushing are not apples to apples, but the frequency with which Jackson is unleashed basically as an RB makes this a relevant piece of data. The Ravens have the fourth-easiest rest of season and easiest Fantasy Playoff RB schedule.
Justin Fields
Justin Fields has the third-highest positive FPOE per game (3.0) after Jalen Hurts (4.2) and Patrick Mahomes (3.9). Not a bad group to be included with. We all saw Fields start the 2022 season slowly. The entire Bears’ offense, with a new coaching staff, stumbled mightily out of the gate. And Fields was a part of the issue at that time, although it was not entirely his fault. Through the first four weeks, Fields finished with the following fantasy point totals:
- 13.6 (QB24)
- 8.8 (QB27)
- 4.9 (QB31)
- 10.2 (QB26)
That’s an average finish of QB27. However, it was not an ideal situation for any QB to succeed in. Through the first four games, the Bears averaged 16 passing targets per game, easily the fewest in the NFL. Even with Fields’ rushing ability, his EP through four games was 16.2. Now, I realize this is bordering on too simplistic of a view. This is what I meant when I said he was not entirely at fault, meaning he harbors some of the blame. In those four games, Fields averaged only 8.5 completions on 16.8 attempts, for a completion rate barely above 50%. His TD/INT ratio was 0.50 (two TDs and four INTs). He averaged 8.5 rush attempts for 36.8 yards (4.3 YPC), with only one rushing TD. He played poorly, which contributed to the overall/relative lack of QB opportunities compared to the league average. Field’s FPOE during that time was -6.9 per game, so even with a hamstrung EP caused by the Bears’ anemic offense, Fields still underperformed significantly.
But something clicked in Week 5. The Bears lost to the Vikings. Fields’ completed 15 passes (season-high at the time) on 21 pass attempts (71.4% completion rate), his first (and only) game with 200+ passing yards, one passing TD, zero interceptions, and eight rushes for 47 rushing yards (5.9 YPC). This might seem insignificant but he finished as the QB12 and had an FPOE of 3.0, his first positive FPOE since Week 1 (1.2). Still not a week-winning performance, but QB12 was a massive leap from his QB27 average finish the previous four weeks. This was also the start of his QB1 run that has yet to end. From Week 5 through Week 11, Fields has finished as the QB7, QB5, QB3, QB1, QB1, and QB7. From Week 5 through Week 10, Field’s average FPOE was 8.1 per game, which by itself is impressive enough. But his EP per game (which was only 16.2 fantasy points in Weeks 1-4) was 22.3 fantasy points. Looking at some of the same statistics as Weeks 1-4, Fields has averaged the following per game in Weeks 5-11:
- 14.6 completions
- 23.0 pass attempts
- 63.4% completion rate
- 2.75 TD/INT rate
- 12.6 rush attempts
- 98.1 rushing yards
- 7.8 yards per rush attempt
- 0.86 rushing TDs per game
While this has not translated into wins for the Bears, it has translated into Fields going from a QB27 average finish to the overall QB6 through Week 11.
There are a couple of factors to note. Fields is dealing with an injury in his non-throwing shoulder, and how much more he plays this season is up in the air. With the Bears being out of playoff contention they could shut him down at some point for the rest of the season. Also, in what is the reverse of Lamar Jackson’s situation, Fields’ season-long FPOE per game (3.0) and the difference between his EP Rank (QB14) and actual PPG Rank (QB6) are largely due to two games (Week 9 and 10) in which Fields scored 42.7 and 39.4 fantasy points (I wasn’t kidding about the Lamar Jackson comparison, look back up at his two blow-up game point totals). His FPOE was an insane 19.6 per game. However, even if you remove those two games during that span, he still averaged 21.5 fantasy points per game, which is right where his overall QB6 average is right now.
Some other QBs who are notably exceeding EP (7+ spots higher in actual PPG rank compared to EP rank): Tua Tagovailoa (+10), Marcus Mariota (+10), Jimmy Garoppolo (+12), and Dak Prescott (+15).
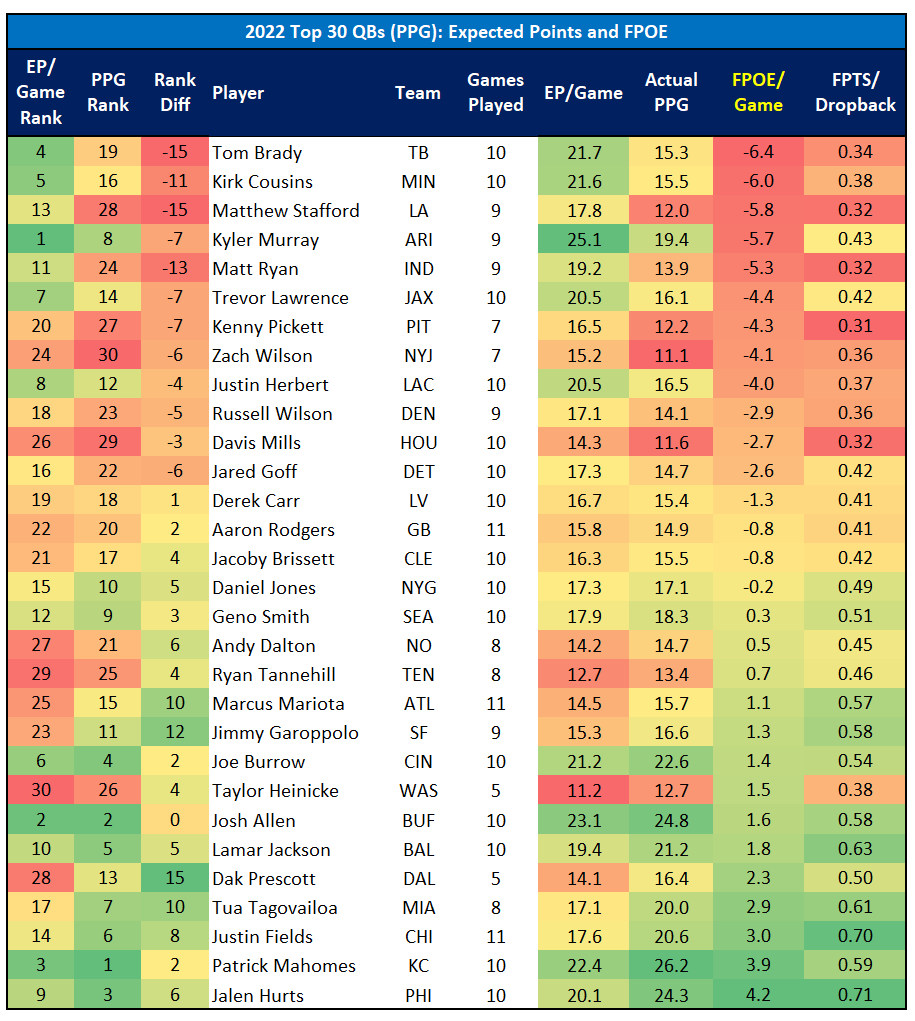
This second chart is sorted by FPOE, lowest to highest.
Tom Brady
We move from green to red in my particular choice for conditional formatting colors. Tom Brady leads the NFL in both negative FPOE per game (-6.4) and the difference in EP rank versus actual PPG rank (-15). If Tom Brady performed at the expectation established by the EP formula through Week 11, he would currently be the QB4 at 21.6 PPG. Many fantasy managers (including myself on multiple teams) wish this was the case. Instead, Brady sits at QB19 with 15.3 PPG.
With Brady, there are not any outliers to help explain his FPOE as there are with Jackson and Fields. Brady has consistently underperformed all season. Outside of Weeks 4 and 5, when Brady finished as the QB4 and QB7 (against the Lions), his average PPG finish has been QB19. He has had a positive FPOE in only one game this season, against the Seahawks in Germany in Week 10. However, he still finished as the QB17 that week.
According to adjusted fantasy points allowed to QBs, the Buccaneers have faced the 21st toughest schedule (or 12th easiest) so far and face the 18th toughest schedule both rest of season and during the Fantasy Playoffs. So Brady’s underperforming also cannot be attributed to an especially tough “to date” fantasy QB schedule. I think the writing is on the wall and Brady’s time as a sure-fire fantasy QB is over.
Kyler Murray
Kyler Murray is another interesting player based on this data set. Murray has the third-most negative FPOE at -5.7 fantasy points per game. The difference between Murray’s EP rank and actual PPG rank is -7. Now, besides Brady, there are other QBs with a greater drop in rank than seven, but Murray stands out because his EP rank is the overall QB1 with an EP per game of 25.1 fantasy points. Murray has missed the last two games due to injury, but in his nine games, he has had a positive FPOE in only two of them. Murray has not been the disappointment many make him out to be, finishing as a QB1 in six of his nine games. But he has played nowhere near his ceiling, another nuanced takeaway that EP and FPOE provide.
For instance, Murray’s highest-scoring game came in Week 2 versus the Raiders. He scored 25.9 fantasy points and finished as the QB8 on the week. However, Murray’s EP in that game was 40.0 fantasy points. That seems ridiculous but the Raiders have been beyond awful versus QBs in 2022. But what this lead to was Murray’s highest fantasy points scored on the season and his lowest FPOE (-13.3) both in the same game. That particular game is an outlier with this type of data, but it helps drive home the point that Murray still has an overall QB1 ceiling in his range of outcomes, but has been closer to his floor in 2022.
Some other QBs who are notably underperforming compared to EP (7+ spots lower in actual PPG rank compared to EP rank): Trevor Lawrence (-7), Kenny Pickett (-7), Kirk Cousins (-11), Matt Ryan (-13), and Matthew Stafford (-15).
Top 30 QBs Fantasy Strength of Schedule
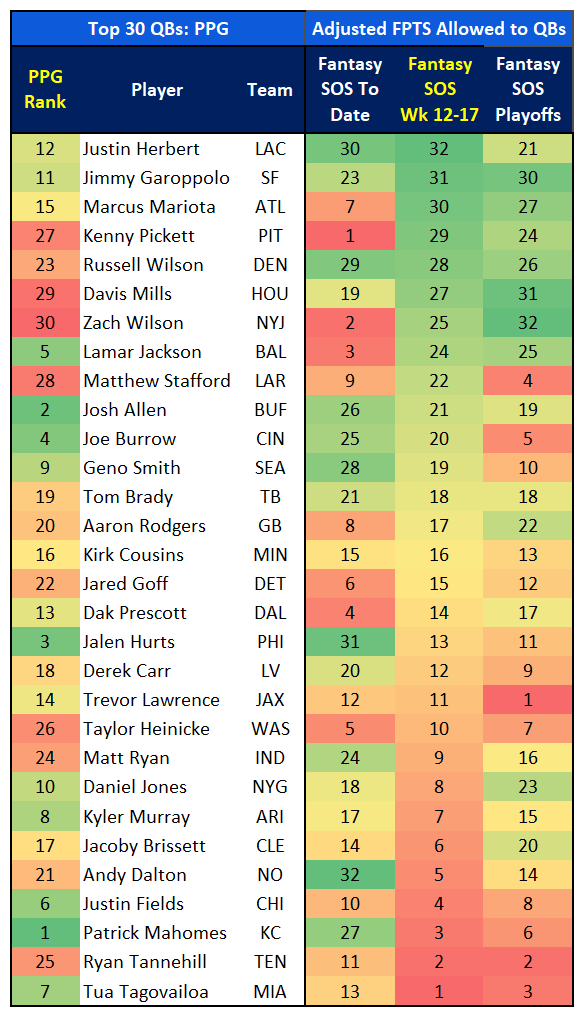
I have mentioned the fantasy strength of schedule for a few of the QBs discussed in this article, so I will leave you with this. The following chart shows this same group of Top 30 QBs, along with their fantasy strength of schedule across the following groups of games:
- Fantasy SOS “To Date” (Weeks 1-11)
- Remaining Fantasy SOS (Weeks 12-17)
- Fantasy Playoffs SOS (Weeks 15-17)
A lower number (red color) indicates fewer fantasy points allowed (tougher schedule).
A higher number (green color) indicates more fantasy points allowed (easier schedule).
These strengths of schedule are based on season-long opponent-adjusted fantasy points allowed rankings through Week 11. The chart is sorted by Rest of Season SOS, from most fantasy-friendly to toughest schedule.
Thanks for reading! If you have any questions about the data used in this article or about fantasy football in general, feel free to hit me up on Twitter.


