
Fantasy Football Beneath the Surface
Another season of NFL football, another pile of data to sift through looking for clues. Clues as to what leads to certain results and clues for speculating what might be coming next. They say, “looks can be deceiving.” The same can be said for surface-level statistics in fantasy football. During the 2022 NFL season, this weekly article series looked beneath the statistical surface, beyond the standard box score, using the premium statistics provided by FantasyData, including advanced and efficiency metrics across the fantasy skill positions, to search for puzzle pieces that fit together. I will be continuing the “Beneath the Surface” series with multiple articles during the 2023 offseason both looking at some historical statistical trends and recapping the 2023 season from an advanced stats angle.
Recently, a fairly common notion was stated on Twitter and made me start thinking. Rookie QBs are good for fantasy TEs because TEs can be an effective safety outlet for an inexperienced signal caller. In general, based on the route trees of most TEs, the position’s average distance of target (aDOT) is closer to the line of scrimmage. Here are the average aDOT numbers for the Top 12 TEs (PPR, PPG), followed by the same number for the Top 24 WRs, dating back to 2009:
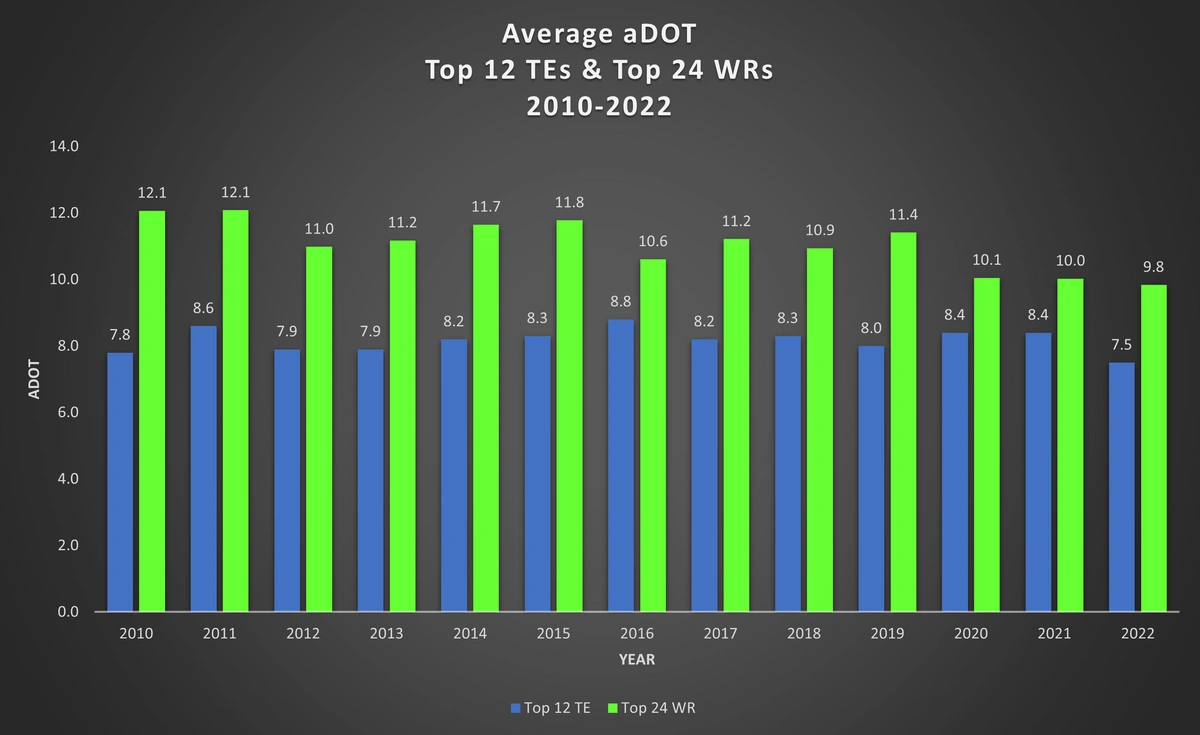
The degree of difficulty for TE targets is less than that of non-slot WRs. Since TEs rarely line up out wide, the combination of relatively shorter routes and being closer to the middle of the field inherently make these throws easier than deeper targets and outside targets. One thing aDOT does not take into account is the actual distance the football is traveling to its target “as the crow flies.” With aDOT, there is no difference between a target to a TE 10 yards from the line of scrimmage in the middle of the field and a target to a WR 10 yards from the line of scrimmage thrown to the left sideline from the right hash mark. But the ball thrown to the WR is traveling much farther from the QBs release point to the WR’s hands.
There seems to be something to this notion specifically relating to TEs with rookie QBs. It makes logical sense. I have said the same thing on multiple occasions and moved right along with my day. This time a question burrowed into my brain. Has this been the case? How have TEs faired relative to previous seasons or career averages when their targets are coming from a rookie QB? And what about a veteran TE joining a new team who brings in a rookie?
Dalton Schultz is now with the Houston Texans and Hayden Hurst is now with the Carolina Panthers with both franchises likely selecting QBs at the top of the draft. What has that situation looked like historically?
So I dove in and spent admittedly longer than I had planned to build a data set in an attempt to measure this quantitatively. This is a high-level view and does leave out some pieces of context, such as the specific offensive schemes and whether those changed along with the incoming rookie QBs. The goal here is to look at the historical trend to see what we might expect with the TEs on teams who draft a QB to start in 2023, in terms of targets per game, target share, and fantasy points per game.
Data for this article was taken from FantasyData.com, Pro-Football-Reference.com, and PlayerProfiler.com.
Rookie QB Impact on TE Production
For this data set, I looked at NFL seasons from 2009 through 2022. In that time frame, I pulled out each scenario where a rookie QB (RQB) started at least 10 games during their rookie season and looked at the team’s TE1 during that season. For the purposes of this article, the term “TE1” means a TE who played at least eight games and lead the team in targets per game during the rookie QB’s season. Using those criteria, the full data set includes the following:
- Rookie QB (RQB) draft capital
- RQB total pass attempts in rookie season
- RQB pass attempts per game in rookie season
- Total team targets & targets per game during RQB rookie season
- Total team targets & targets per game during the team’s previous season for comparison
- Team TE target share during RQB rookie season
- Team TE target share during the team’s previous season for comparison
- Who was the TE1 and was the TE1 an incumbent, new to the team, or a rookie
- TE1 NFL experience and games played during RQB rookie season
- TE1 targets per game and that team’s TE1 targets per game from the previous season for comparison
- TE1’s career targets per game for comparison
- TE1 target share and that team’s TE1 target share from the previous season for comparison
- TE1’s career target share for comparison
- TE1 PPR PPG during RQB rookie season
- TE1’s PPR PPG during the previous season for comparison
- TE1’s career PPR PPG for comparison
- TE1 PPR finish during RQB rookie season
- TE1’s PPR finish during the previous season for comparison
Rookie QBs (RQB)
This is a lot of data, so I focused mainly on the comparisons and looked at the average difference in those comparisons over the 14-year span. This is too much to present in one table, so I will break it down into different sections and tie it together as the article progresses. Since 2009, there have been a total of 36 RQBs who fit the criteria listed above. We will start by looking at the RQB and team passing data (Numbers 1-7 in the list above):
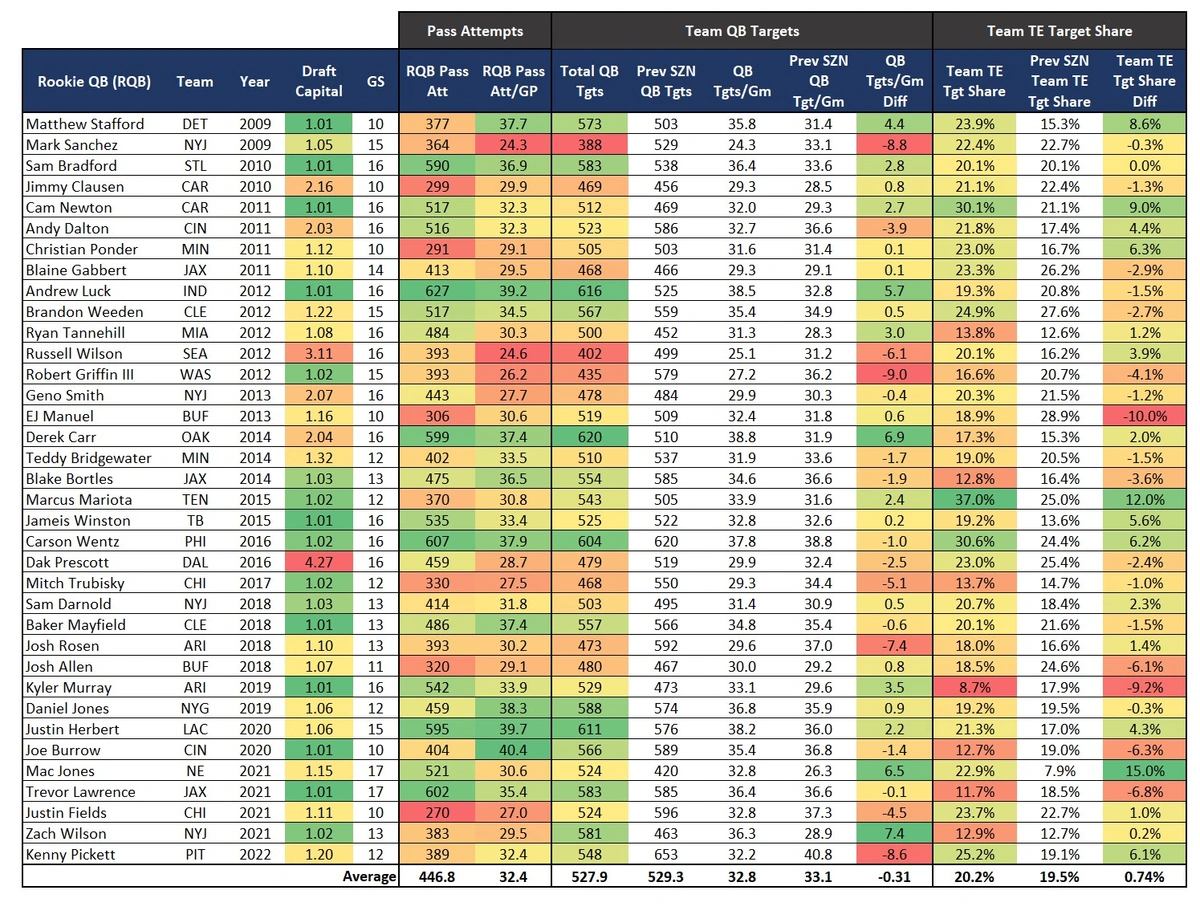
You can see a diverse list of QBs on this list, from QBs who lasted only one season to elite-level QBs, some of whom are still playing or just started their career. Of the 36 QBs, only six were not first-round draft picks. And of the 30 first-round picks, 23 were Top 10 picks in the NFL Draft. You will also notice some noteworthy QBs are missing, such as Patrick Mahomes, Aaron Rodgers, and Kirk Cousins (among a few others). They did not meet the 10+ starts during their rookie season criteria.
So the skill level of these RQBs is all over the map, and I won’t be digging too deep into that variable. Some individual seasons are worth discussing further as they help to convey the larger trends. Also not included will be other factors such as coaching or front office changes, or changes in offensive schemes. The information matters when looking at individual seasons, but over a 14-year span, those pieces become baked into the overall averages. You can see some very low and very high totals in this table. The two lowest RQB pass attempts per game were turned in by Mark Sanchez in 2009 (24.3) and Russell Wilson in 2012 (24.6). Concurrently, the total team QB targets per game for those two teams were significantly lower than the previous season. And logically, in most cases, the lower end of this spectrum includes QBs who could at least do some damage with their legs.
The two highest RQB pass attempts per game both occurred in 2020, with Justin Herbert (39.7) and Joe Burrow (40.4). The higher end of this spectrum does not always also represent an increase in total team targets per game during the RQB season, as the Bengals saw a decrease in total team targets per game during Burrow’s rookie season compared to 2019.
You can also see that team TE target share is not directly tied to pass volume. The two biggest drops in TE target share occurred in Buffalo in 2013 and Arizona in 2019. During EJ Manuel’s rookie year, the Bills’ team TE target share was 18.9%, exactly 10.0% lower than the previous season, even though team targets per game went up by 0.6. With Kyler Murray, the Cardinals’ team TE target share was 8.7% in 2019. So, even though their total team targets per game went up by 3.5, the TE target share went down by 9.2% compared to 2018. This does not mean a lot until we introduce the TE data into the mix. TE personnel (who the TE options are for a given QB) have a significant influence on these numbers. Just look at a few ends of this spectrum. One of the highest team TE target shares (and greatest TE target share increases) was during Marcus Mariota’s rookie season. This was right in the middle of Delanie Walker’s prime as an upper-level TE in the NFL. The Cardinals’ 8.7% team TE target share in 2019 is the lowest on this list by far. Who was Murray’s TE1 that season? Charles Clay in his ninth season.
Overall, the 14-year averages include total QB targets per game decrease of -0.31 and a team TE target share increase of 0.74% once these RQBs took over.
TE Target Data
Now we move to the TE1s each of these 36 RQBs was throwing to during their rookie season. As a reminder, a team’s TE1 in this data was the TE who played at least eight games and was the TE leader in targets per game. You will see, much like the RQBs, this is a wide-ranging group of TEs. The following table still includes the RQBs for clarity and adds their TE1 target and target share data (Numbers 8-13 on the list above).
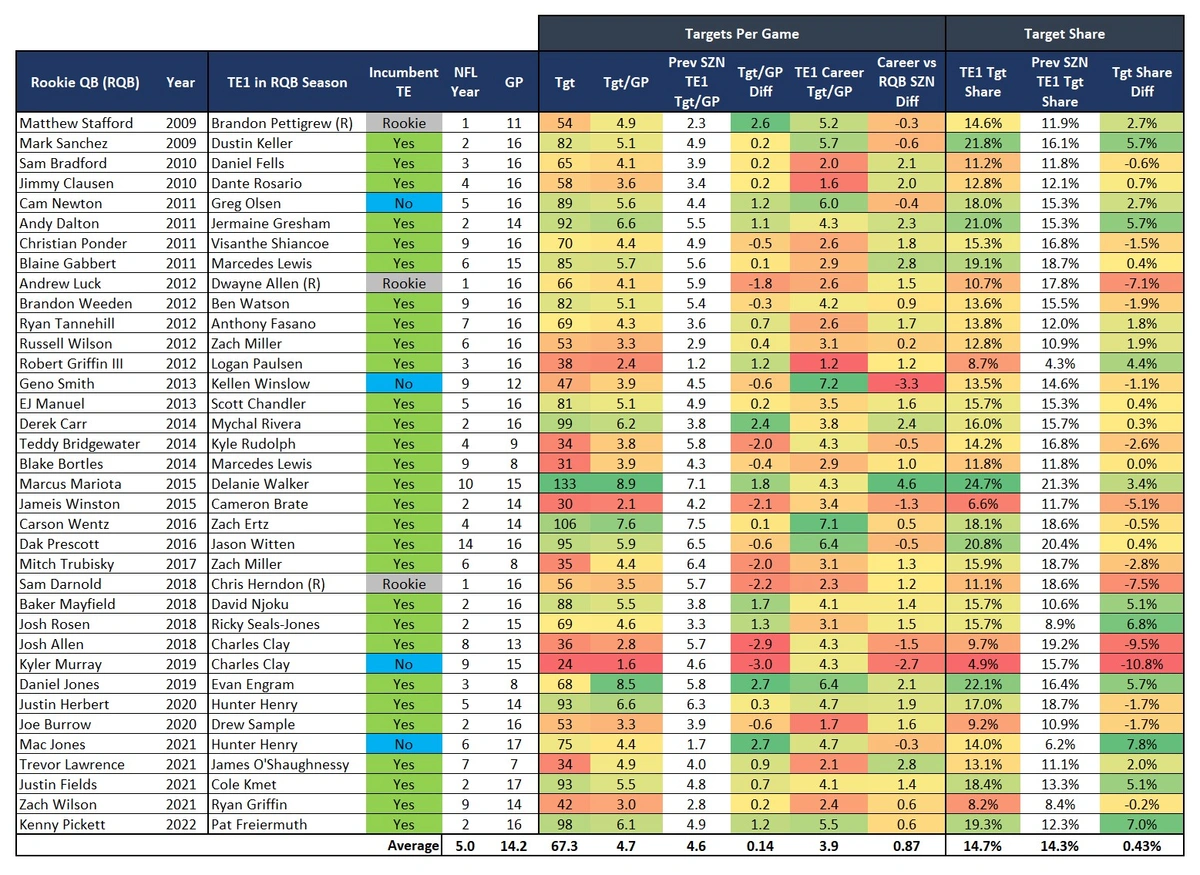
You can see this data is broken up into multiple points of comparison between the RQB’s rookie season and the previous season. Again, for any individual season, I would discuss additional factors when looking at why the TE1 targets per game or target share fluctuate and provide the differences (both increases and decreases) you see in this table. And although 36 is not a large sample size (relatively speaking), combined with the 14-year span and diversity of situations and players, I do think it is effective in presenting trends that assist in answering the question of this article.
Starting with the TE1s themselves, you see a wide range of NFL experience. Only three of the TE1s were rookies during the RQB season (Brandon Pettigrew in 2009, Dwayne Allen in 2012, and Chris Herndon in 2018). Two of the TE1s were into double digits when they spent their season with their respective RQB (Delanie Walker in his 10th season and Jason Witten in his 14th season). But on average, the season in which the TE1 was catching passes from an RQB was their fifth. And the majority of the TE1s played close to a full season, with only six playing in less than 12 games. It should be noted that James O’Shaughnessy breaks the minimum of eight games rule only because he was the only TE close to that mark in 2021 with Trevor Lawerence.
Most of the comparisons here are between the TE1 listed and the TE1 on that same team the previous season. The only data point where I followed the TE1 into the previous season instead of the team’s TE1 is with fantasy points per game (coming in the next table). However, Greg Olsen (2011 with Cam Newton), Kellen Winslow (2013 with Geno Smith), Charles Clay (2019 with Kyler Murray), and Hunter Henry (2021 with Mac Jones) were the only non-rookie TEs who were also new to the team during the RQB season. But I did bring in some of the TE1’s career numbers for comparison as well.
Regarding targets per game, the 14-year average shows the TE1’s targets per game during the RQB season represented a 0.14 increase compared to that team’s TE1 the previous season (and as I said, typically it was the same player). That is not a significant increase, but targets per game alone don’t tell the whole story. That is why bringing in the career numbers for the TE1s is important. When you compare the TE1 targets per game during the RQB season to their career average, a more noticeable positive difference emerges. That 14-year average shows a 0.87 increase in targets per game. So on average, when compared to their career number, the TE1 saw an increase of almost a full target per game (+0.87) with the RQB. And yes, comparing a single-season average to a career average will always differ more significantly than comparing two single seasons, but it throws support back to our seemingly tiny increase of 0.14. With season-to-season comparisons inherently having less variance than season-to-career, the fact that it’s positive at all lends support to the notion that RQBs are at least not an obvious downgrade for a TE.
I mentioned “TE personnel” earlier and you can see what I mean with this list. There are some very talented TEs on this list. But there are others we have barely heard of or remember. As a quick exercise, I broke down these TE1s into three tiers:
- Upper Tier: Career targets per game above 5.0
- Middle Tier: Career targets per game between 3.0 and 4.9
- Lower Tier: Career targets per game below 3.0
Based on those criteria, here are the percentages of TE1s in each tier:
- Upper Tier: 22.2%
- Middle Tier: 44.4%
- Lower Tier: 33.3%
This is a fairly “normal” dispersion with the bulk falling in the middle and less at the top and bottom. But this counteracts issues with the sample size as the data is not being skewed downward by a bottom-heavy group or upward by a top-heavy group. To put it another way, if this group was filled with Travis Kelce and Rob Gronkowski, it would inaccurately paint a picture of RQBs being the magic bullet for TEs. Whereas if it was filled with only Daniel Fells and Donte Rosario (no offense intended toward either player), it would warp the perspective toward RQBs being a death knell for TEs.
With target share, it is a similar seemingly small average increase of 0.43% from the TE1 of the previous season to the TE1 with the RQB, but it follows the same logic as targets per game. While it is not the smoking gun proving RQBs are good for TEs, it is strong support that RQBs are not a downgrade for TEs either.
But enough with all this right? In the end, we need fantasy points so what does this all look like with TE1 fantasy points during an RQB season?
TE1 Fantasy Points Data
Thus far the data has leaned toward the promising side of TEs being slightly better off during an RQB season. Does the same trend materialize with TE fantasy points? Upon first glance, looking at the same sample size of 36 scenarios fitting our criteria, the data looks similar. The following table shows the 36 RQBs and their respective TE1s and shows each TE1’s PPR PPG and TE finish during the RQB season. Included for comparison are the following:
- TE1’s PPR PPG during the RQB season
- TE1’s PPR PPG from the previous season
- TE1’s career average PPR PPG
- TE1’s finish during the previous season
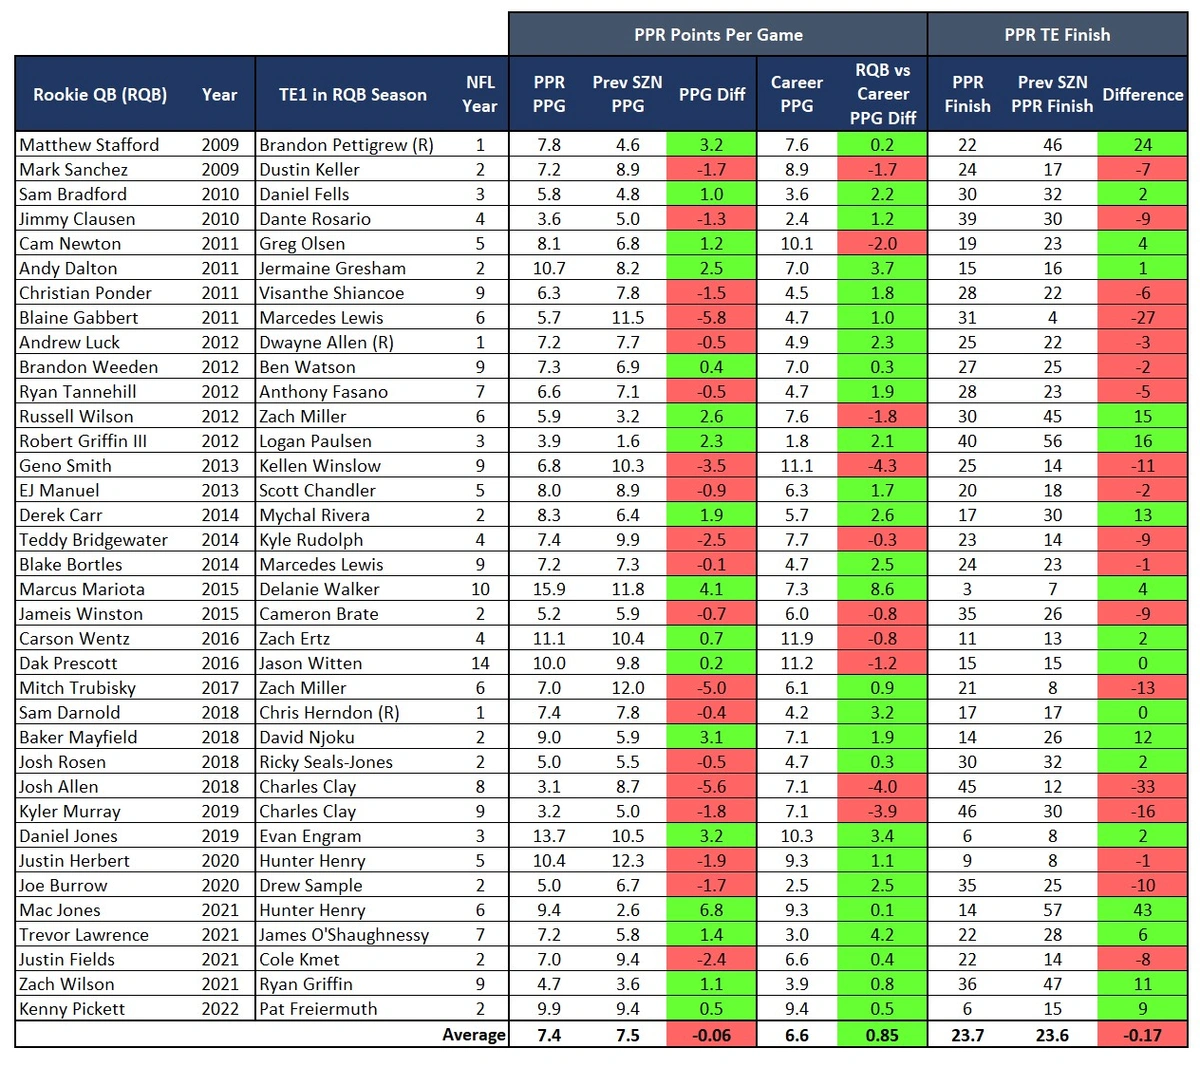
Similar to targets per game, the difference between the RQB season and the previous season is very close to zero (-0.06). It is the difference between the RQB season and the TE1s’ career average that is promising. As with targets per game, the TE1 was almost a full PPG above their career average (+0.85) during the RQB season, when averaged across this 14-year, 36-scenarios data set. The TE finish average was slightly negative at -0.17.
Looking at individual instances of either a positive (bright green color) or negative (red color) difference gives you the following:
- 38.9% (14 of 36) TEs had an increase in PPG compared to the previous season
- 72.0% (26 of 36) TEs had an increase in PPG compared to their career average
- 50.0% (18 of 36) TEs finished with a higher rank than the previous season
So again, it seems that when compared to their career average, whether it’s targets per game or fantasy points per game, the RQB looks to be a positive impact on the TE1. That is until you drill down a little further. Until now we have only been looking at the full data set across the 14 seasons and 36 RQB-TE1 examples. But with fantasy points data, another question arises. What does this look like for TEs who are actually fantasy relevant? Yes, this will shrink the sample size but we cannot ignore how TEs we might actually start in our fantasy lineups have performed.
Top 24 Fantasy TEs
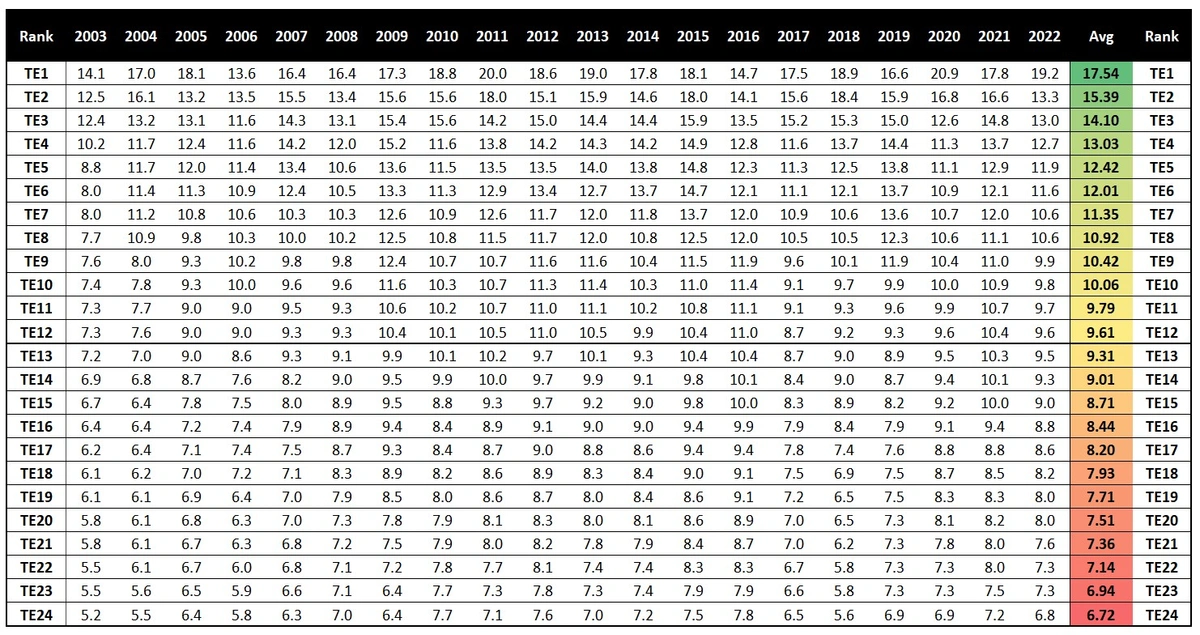
To arrive at this data set I did not look at these TE’s finishes in individual seasons. A numbered rank isn’t as sticky as actual points per game numbers. So, I looked at the Top 24 TEs (PPG, minimum eight games played) going back to 2003, and averaged the TE1 PPG, TE2 PPG, TE3 PPG, etc. to arrive at these thresholds. What that data shows is a Top 12 TE is a PPG above 9.6, and a Top 24 TE is a PPG above 6.7.
Now we can drill down into the fantasy-relevant TEs. The following table shows only the TE1s who put up a Top 24 PPG (>6.7) number the season prior to the RQB season.
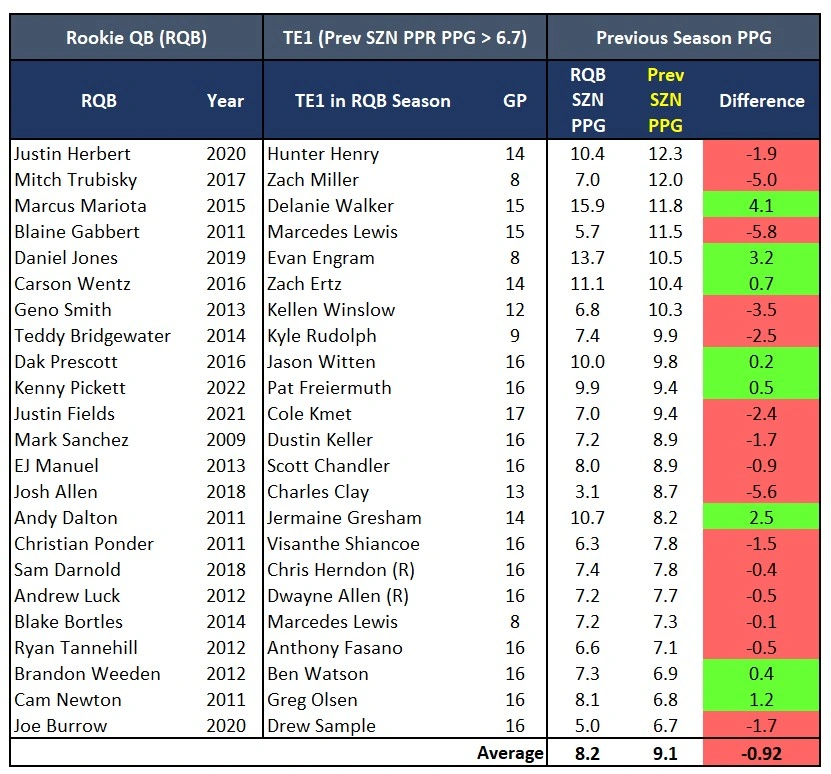
A total of 23 TEs scored more than 6.7 PPG the season prior to the RQB season. Of the 23, only 34.8% increased their PPG with the RQB. On average, the PPG for these 23 TEs decreased by close to a full PPG (-0.92) during the RQB season.
Here are the TE1s with a career PPG average above our Top 24 threshold of 6.7:
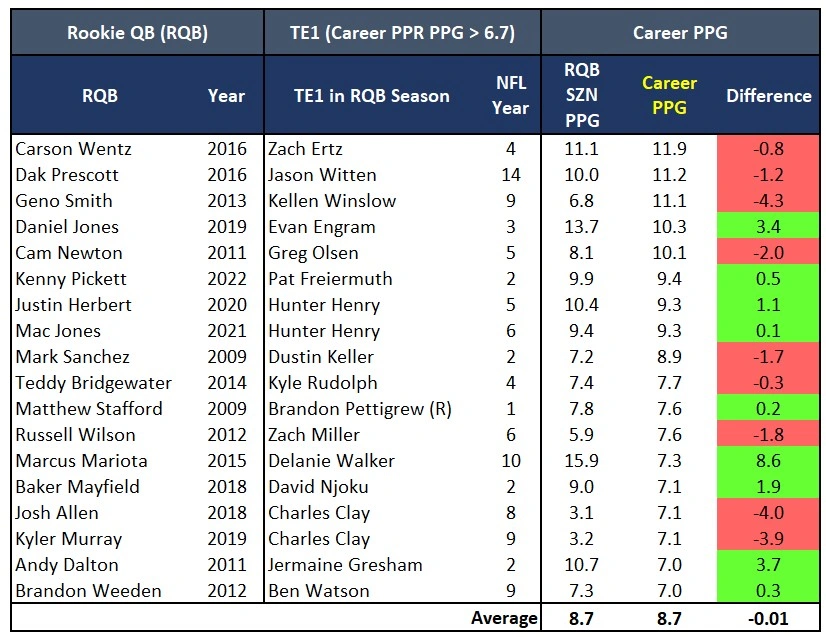
A total of 18 TEs had a career average PPG above 6.7. Of the 18, 50.0% increased their PPG with the RQB. On average, the PPG for these 18 TEs barely changes during the RQB season (-0.01). Once again, comparing to career numbers looks better than comparing to the previous season, but with fantasy-relevant TEs we are now at no difference rather than the positive differences we saw with the full 36-player sample size.
Now for the last data set. The Top 12 TEs, or TEs whose previous season or career average PPG were at or above 9.6. Here is the group with > 9.6 PPG the season before the RQB season::
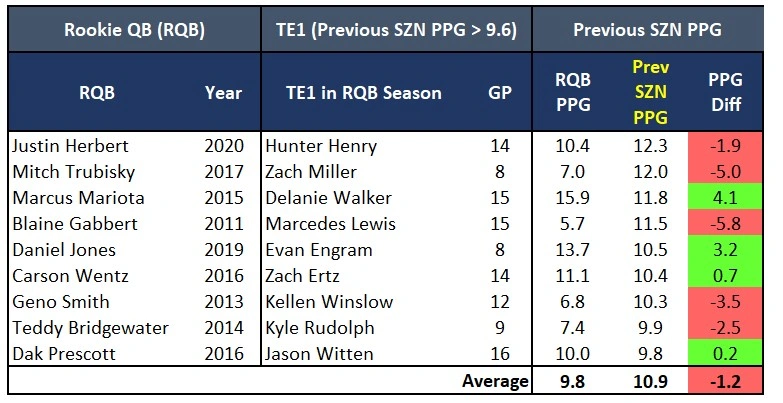
Now we are down to only nine examples, with 44.4% increasing their PPG with the RQB. On average, the PPG for these nine TEs decreased by 1.2 during the RQB season. Lastly, we have the TEs from the 36-player sample size whose career average PPG was at or above the Top 12 threshold (9.6):
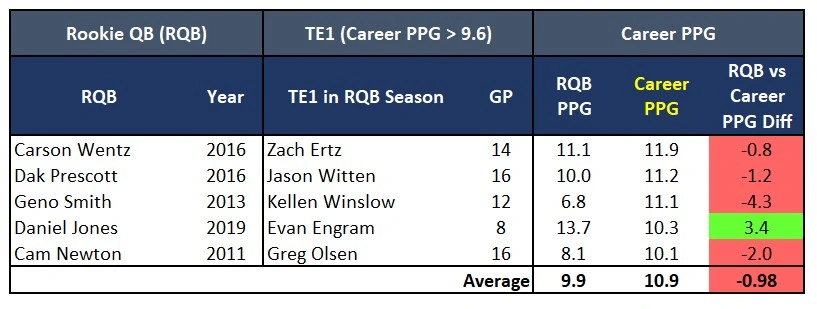
Only five TEs fit these criteria, and only one of them (20.0%) increased their PPG with the RQB. The average PPG difference across this group is -0.98. I realize these are small sample sizes but I still think it tips the scale in the opposite direction from where it was leaning earlier in this article. When it comes to fantasy-relevant TEs, the historical data points to an RQB having a negative impact on their fantasy scoring. The larger 36-player data set is important to see general trends, but within that sample, many irrelevant TEs (for fantasy purposes) were likely propping up the numbers especially as it pertains to what matters for fantasy football, opportunity, and production.
Thanks for reading! If you have any questions about the data used in this article or about fantasy football in general, feel free to hit me up on Twitter.