

As part of our 2020 Fantasy Football Draft Kit here at FantasyData, we have created a custom strength of schedule projection model with in-depth analysis to help you in your quest for a championship title. Strength of schedule (SOS) is a tool I have used ever since I started playing fantasy as a part of draft preparation. This, along with personal rankings and ADP are cornerstones of conducting a solid draft. One of the best parts about using SOS is being able to compare two players you have ranked pretty much identically with similar ADPs to see which one might have a slight edge with an easier schedule, especially in the final quarter of the fantasy season (Weeks 13-16) when wins matter the most.
Method of Projection and Numbers to Know
There are a few different ways people project SOS for an upcoming fantasy season. The way I prefer to do this is by using a recent sample of the last two seasons’ fantasy points allowed ranks and points per game (PPG) allowed ranks. I compare these side-by-side to find an average that I am happy with and use that for the upcoming season to determine where a team could potentially rank against a position in fantasy points allowed. It’s a fairly simple method, but in doing this, I have found that most teams don’t have a drastic change in fantasy points allowed from one season to the next. To back that up, here are some key numbers worth knowing before we dive into this more:
Over the last two seasons, of the teams that rank top-five in most fantasy points allowed to QBs on average, none of them moved more than eight spots between the 2018-19 seasons, and the top three moved just half a point or less. The Saints were the team that moved the most from ranking third-most in 2018 to 11th-most in 2019. That move resulted in them allowing an average of 20.6 PPG in 2018 to 19.3 in 2019, a difference of just 1.3 PPG. So, using this projection model, we have them projected to give up the fifth-most fantasy points to QBs this season at 19.95 PPG. Above-average, which is likely, and even if this is wrong and they continue to progress toward the mean, the difference between them ranking fifth most at 19.95 PPG to average (16th most) is a marginal difference of about 2.5 PPG.
Similarly to how we looked at teams who ranked top five in most points allowed, let’s look at those who ranked top five in fewest fantasy points allowed. Of these teams, only one of them has moved more than six spots in their points allowed ranks or more than 2.1 PPG over the last two seasons. That consistency actually ranges beyond those five, as fewer than half of the teams we have projected to finish below average in fantasy points allowed have moved more than 10 spots over the last two seasons. 10 of these 16 teams moved less than three PPG over the last two seasons and eight of them moved less than two PPG. The one team inside the bottom five that moved the most recently was the Patriots who went from ranking 13th in 2018 allowing 18 PPG all the way to 32nd (least) in 2019 allowing just 11.7 PPG.
The average amount of fantasy points allowed to QBs over the last two seasons on a per-game basis was 17.5 PPG. The Bengals have given up the most PPG to QBs over the last two seasons at 21.05 PPG. So the difference between average-to-most points allowed has been only about 3.6 PPG. The slightly larger variance you will see here is the difference between the average points allowed (17.5) and the fewest, which belongs to the Buffalo Bills who have allowed just 12.8 PPG over the last two seasons, a difference of 4.7 PPG. On average, teams have moved nine spots in their rank between the last two seasons which has resulted in a season-to-season change of just 2.5 PPG, though technically, 18-of-32 teams moved less than 2.5 PPG between the last two seasons.
So, to boil this all down, the teams who rank top five and bottom five have shown strong consistency to stay that way from one season to the next, making them really safe bets to either target or stay away from. You get more variation in the ranges of outcome in the slightly above, below, or right at average ranks.
Now, let’s break down some grids looking week-by-week at some of the best and worst teams to target this season based on their strength of schedule! These are ranked from 1-to-32 with 1 being the easiest and 32 being the toughest.
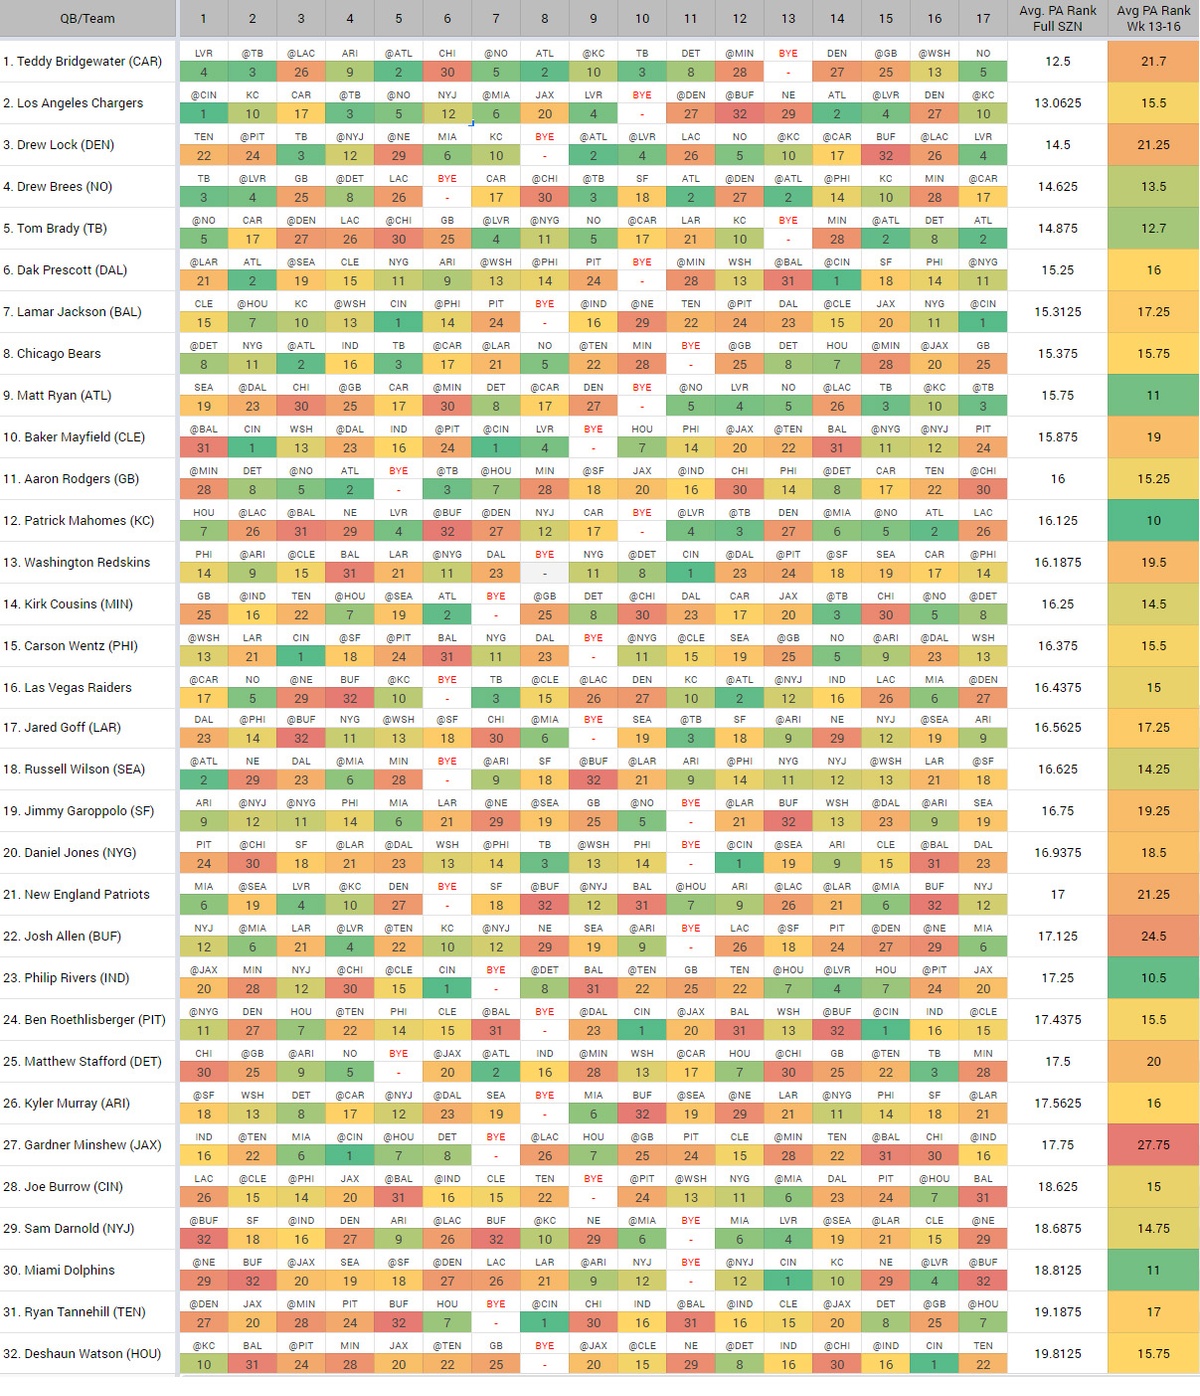
Top Five Easiest Strength of Schedule: Full Season

1. Teddy Bridgewater – Carolina Panthers
This is about as easy as it gets this season for new Carolina Panthers QB, Teddy Bridgewater. He only has six matchups against teams who could rank outside the top 10 in most fantasy points allowed to QBs this season. He has seven matchups against teams that rank inside the top five and as our research showed us, those are the teams that are most likely to stay inside the top five based on past consistency. The only downside to Teddy’s schedule here is that the Panthers are one-of-two teams (the Bucs being the other) who got slapped with a Week 13 bye this season. He also winds up getting two of his toughest matchups of the season right at the beginning of the traditional fantasy playoff schedule in Weeks 14 and 15 (more on that below).

2. Tyrod Taylor / Justin Herbert – Los Angeles Chargers
Whoever starts under center for the Chargers this season is going to be gifted a pretty friendly schedule. Most notably, they get a cushy start to their season getting the Bengals in Week 1 whom we have projected to allow the most fantasy points to QBs this season. They have allowed an average of 21.05 PPG to fantasy QBs over the last two seasons. The first nine games before the Chargers bye could actually be even easier than this projects as well. Of the two tougher matchups here, The Panthers who we have ranked 17th allowed the 10th most fantasy points to QBs in 2018 (18.9 PPG) before making adjustments and allowing just the 22nd most in 2019 at 16.2 PPG. The Jaguars, on the other hand, went the opposite direction. They went from ranking 26th in 2018 at 15.4 PPG and fell to 12th in 2019, allowing 19 PPG. We get a tough stretch after the bye week with three daunting matchups, two of which are on the road in the cold-weather climates of Denver and Buffalo (Tyrod revenge game?) before the Chargers return home to take on the Patriots. The QB here could rebound just in time for the playoffs at home against Atlanta in Week 14 and taking a short journey to Vegas to face the Raiders. The Week 11 matchup against Denver will help give you insight as to whether or not you’re able to trust the Chargers QB in Week 16 if you’re lucky enough to make it that far and don’t have a better option.

3. Drew Lock – Denver Broncos
Sure, let’s add more fuel to the hype-fire of Drew Lock. Considered one of the biggest winners of the 2020 NFL Draft from an offensive weapons standpoint, Lock will also be given a schedule that ranks top-three in most fantasy points allowed to QBs. His schedule appears to be set up with plenty of room for a rollercoaster-season narrative that media tabloids will surely love. Two tough matchups to start the season should start the talks of him not being the QB of the future, then he gets five of his next six matchups against teams who all rank inside the top 12 for most points allowed to QBs. The only tough spot there is a matchup against the Patriots in New England, but that team could be a shell of its former self this season. Lock and the Broncos could keep rolling and help you make the playoffs with that potential shoot out against the Chiefs in Week 13. The ride could stop in Weeks 14-16, however, as we mentioned the Panthers could be slightly better than 17th this season based on the potential trend forming over the last two seasons. The Bills are absolutely not a great matchup having allowed just 12.8 PPG on average over the last two seasons, but I guess the silver lining here is it’s a home game. Then you get a road game against the Chargers who moved from ranking 20th in 2018 (16.6 PPG) to 27th in 2019 (14.7 PPG). Unfortunately for fantasy purposes, the Broncos only get the Raiders once this season in the traditional fantasy season schedule.

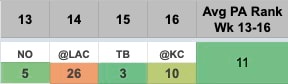
4. Drew Brees – New Orleans Saints
Load up on NFC South QBs, why don’t you!? Drew Brees may not be putting up the monster fantasy performances that we remember from him in his prime, but he’s sure got the schedule to do so again this season in a push for the Super Bowl. Week 1 will surely be one of the marquee matchups of the early season as the Saints host the new-look Patriots, I mean, Buccaneers. Another soft matchup against the Raiders gives Brees a shot to start the season hot. We get our yearly dose of the battle of the domes with two matchups against a likely-soft Falcons defense. Brees will also get a game loaded with shoot out potential in the heart of the fantasy playoffs against Patrick Mahomes and the Chiefs in New Orleans. It’s worth noting that the Chiefs improved to 18th in 2019 allowing just 17 PPG, but they ranked a very friendly 2nd in 2018 allowing 21.2 PPG.

5. Tom Brady – Tampa Bay Buccaneers
Welcome to the NFC South, Mr. Brady. In his first season out of New England whose SOS ranks 21st this season, Brady will get a taste of the cupcake schedules that Jameis Winston had to work with over the last few years in Tampa. The only difference here is that Brady is actually a good QB. The first quarter-plus of the season may be a bit of a lull for Brady and the Bucs as they get most of their tough matchups out of the way in the stretch between Weeks 2-6. This is worth remembering if you don’t wind up drafting Brady but notice him going through some early-season struggles. A buy-low window could open and pay off nicely, especially when we look at Brady’s final two games in the fantasy playoffs in Weeks 15 and 16 against Atlanta and Detroit. There may be enough magic left in that old arm to pull off some solid QB1 weekly finishes throughout the season.
Top Five Toughest Strength of Schedule: Full Season

28. Joe Burrow – Cincinnati Bengals
We’re going to find out pretty quick here if Joe Burrow’s magical season at LSU will translate into success at the NFL level. It’s really hard to get excited about the prospects of him becoming a potential QB1 in fantasy as a rookie when looking at this schedule. The optimist in me looks at a lot of these matchups though that are in the average range of ranks (14-16) and the average amount of points they have allowed over the last two seasons like Philly (14th, 18.35 PPG), Cleveland (15th, 18 PPG), and Indy (16th, 17.65 PPG). Of these three teams, Philly is the only one on a positive trend when it comes to points allowed as they moved from 6th in 2018 all the way to 18th in 2019. Their addition of players like Darius Slay could keep that upward trend. However, as I noted earlier, gradual shifts from one year to the next don’t necessarily equate to a huge change in fantasy points allowed. For example, that change from 6th to 18th for Philly only resulted in a difference of 2.7 PPG. Their move of 12 spots in points allowed was also slightly above the league average of nine. So, maybe we shouldn’t get too scared off by those matchups, but the fact that Burrow doesn’t have a single matchup against a team we have projected to finish top five in points allowed is a bit of a bummer. To make matters worse, his two best matchups of the season against Miami (6th, 19.85 PPG) and Houston (7th, 19.55 PPG) will both be on the road.

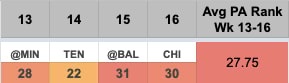
29. Sam Darnold – New York Jets
You can’t help but wonder what Sam Darnold would look like if he hadn’t wound up with the New York Jets. There’s so much to dislike about Darnold and the Jets without one of the worst strength of schedule’s in the mix, but when you add that to it, you can’t help but feel bad for the kid. In the first half of the season, you get two potentially decent matchups at home against the Cardinals (9th, 19.15 PPG) and on the road against the Chiefs (10th, 19.1 PPG). The downside of these two matchups is that Arizona is actually kind of an enigma when it comes to how many fantasy points they will allow to QBs this season. They ranked 27th against QBs in 2018 allowing just 15.4 PPG then swung 26 spots to allow the most points in 2019 at 22.9 PPG. This was an abnormal shift considering the majority of the teams in the league. Then the game against the Chiefs being in Kansas City could be less than ideal as that is notoriously one of the toughest stadiums to play in as a road dog. The bye sandwich of their usual two games against Miami helps raise their average opponent rank as well as a home game against the Raiders in Week 13. After that, you probably won’t be too comfortable trotting Darnold out through the playoffs.

30. Ryan Fitzpatrick / Tua Tagovailoa – Miami Dolphins
You could easily string together a narrative here that it doesn’t really matter who the starting QB is in Week 1 for the Dolphins because that man will have his work cut out for him to start the season. The Phins get a nightmare duo of facing the Pats in New England for the season opener, then a home opener against the Bills who have allowed just an average of 12.8 PPG to QBs over the last two seasons. They’ll get three of their next four matchups after that on the road against tougher than average competition. Things won’t lighten up until the midway point of the season where they could find themselves already thinking they may need to make a switch at QB. If we can get some quality play out of this team when the schedule lightens up between Weeks 9-12, there are actually some attractive matchups over the final quarter of the season at home against the Bengals and Chiefs, then the road game against the Raiders. That is reminiscent of the Dolphins’ 2019 season where Fitzpatrick finished out the final four weeks of the fantasy season as a top-five QB averaging 22.7 PPG (more on this below).

31. Ryan Tannehill – Tennessee Titans
What if I told you that the majority of Ryan Tannehill’s success last season was actually due to a string of great matchups and not so much that he just suddenly warranted weekly QB1 consideration? When you look at his game logs you will find just that. Of his eight top-12 performances last season, only two were against defenses who didn’t rank inside the top 12 in fantasy points allowed to QBs. This is worth noting because he only has two matchups this season against teams who we have projected to rank inside the top 12 this season. The first five weeks are pretty ugly, though Tannehill did put up 32.4 fantasy points against the Jags in Week 12 last season, finishing as the overall QB2 that week. The Jags allowed the 12th most points to QBs last season at 19 PPG, so there is some wiggle room in that one and he will face them again in Week 14. He gets his two best matchups of the season sandwiched in between the team’s Week 7 bye. He has a similar stretch as what we saw with Burrow against Indy twice and Cleveland where the optimist could see him performing well there. A home game against Detroit in the heart of the fantasy playoffs is also definitely worth a start. It will really depend on where Tannehill’s ADP shakes out when we’re in the heart of draft season, but I would be weary drafting him as anything more than a boom/bust player with the second-toughest SOS.

32. Deshaun Watson – Houston Texans
The hits keep coming for the value of Deshaun Watson. First, the team trades away his elite target with DeAndre Hopkins now in Arizona. Now, he’s given the toughest schedule for QBs this season. The Texans WR corps could fall apart at any moment given how fragile they are, putting the team in a similar situation to what we saw from the Eagles last year. To understand how Watson could perform with this schedule, I had to really break it down similar to how we did with Tannehill to see if there is a glimmer of hope. Last season, Watson put up just four fantasy points against Baltimore in Week 11 which doesn’t bode well for his Week 2 matchup against them this season. In his two matchups against Jacksonville last season, he finished as the QB22 in Week 2 and QB11 in Week 9, so we have some mixed results there, though Houston did win both games. He finished as just the QB15 in Week 15 at Tennessee last season. He finished as the QB9 against New England last season, so that could be a better than expected performance. Lastly, he had finishes of QB17 and QB10 against the Colts last season, giving mixed results as well. So for just those matchups alone last season he had an average finish of QB16. He finished as a QB1 in just three of those seven matchups. So, his value will really come down to how he performs against some of the teams we haven’t seen him play against recently (or ever) like Pittsburgh (24th, 16.25 PPG), Minnesota (28th, 14.9 PPG), Green Bay (25th, 16.05 PPG), and Chicago (30th, 14.15 PPG). All of which, as you can see, are pretty terrible matchups on paper. I love Deshaun Watson, he’s probably my favorite QB in the league, but I probably won’t own him anywhere this season in fantasy.
Best Quarterbacks for a Fantasy Playoff Push: Weeks 13-16
1. Patrick Mahomes – Kansas City Chiefs
As if you needed more reason to draft Patrick Mahomes this season, he gives you the easiest SOS of any QB between the must-win Weeks 13-16. Even that matchup he has at home against Denver in Week 13 isn’t as bad as it looks for him. He put up 20.7 fantasy points at home against Denver in Week 15 last season, finishing as the QB6 that week. I know that waiting on a QB is all the rage and it makes a ton of sense, I don’t argue with it. But we know Mahomes is special and when you give him an easy schedule like this on top of it, it kind of warrants taking him early in drafts.
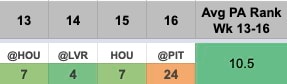
2. Philip Rivers – Indianapolis Colts
While Philip Rivers’ schedule is almost as easy as that of Mahomes on a points-allowed rank, it presents a few different obstacles that make it less ideal outside of standalone player value. First, we will have to see how Rivers performs all season really on a brand new team for the first time in his career. Second, his playoff schedule will largely depend on how well he plays against the Texans alone given their two matchups over these four games. And third, we will have to see both how well Rivers performs on the road this season with three of these games being away games as well as how much better each defense plays home vs. away as well. So there is a lot to think about here, but luckily you will have a better feel for his potential by the time we get to Week 13 in the season. On the season as a whole, Rivers offers a slightly-below-average SOS ranking 23rd.
T-3. Ryan Fitzpatrick / Tua Tagovailoa – Miami Dolphins
We already touched on the difficult full-season schedule the Dolphins are up against, but this reinforces that there could be some gems hidden in an otherwise ugly season. It’s also again worth noting that Ryan Fitzpatrick finished out the final four weeks of the 2019 fantasy season as a top-five QB averaging 22.7 PPG. The team getting three of these games at home is also another feather in their cap.
T-3. Matt Ryan – Atlanta Falcons
Matt Ryan was the only QB from the NFC South not featured in the top five easiest schedules for the full season, but he just makes the cut for the top three easiest during the playoffs. On the season, his schedule ranks ninth, so still pretty good overall. The two best matchups he gets are also conveniently both home games. There’s also plenty some appeal in his two road games during this stretch. This will be his first time traveling to Los Angeles to face the Chargers. He hasn’t played against them on the road since 2012 when they were still in San Diego. In his career, he has a 5:1 TD-INT ratio against the Chargers on the road, though this would probably be the toughest defense he has faced from them. Similarly, with the Chiefs, Ryan hasn’t faced them on the road since 2012 also but he had a solid performance then as well throwing for 299 yards with three TDs. There’s always the potential for a shootout with KC.
Worst Quarterbacks for a Fantasy Playoff Push: Weeks 13-16
1. Gardner Minshew – Jacksonville Jaguars
Minshew and the Jags just missed out on the top five toughest SOS for the full season ranking 27th, but they do have the absolute worst SOS over the fantasy playoffs. Of these four teams, the Vikings, Ravens, and Bears have all allowed less than 15 PPG on average over the last two seasons. The tough part about this schedule also is that the only one of these teams that Minshew played against last season was the Titans where he put up 18 fantasy points in Week 3 finishing as the QB15. It’s worth noting that Minshew does have a decent early stretch in his schedule between Weeks 3-6 where he will face Miami (6th, 19.85 PPG), Cincinnati (1st, 21.05 PPG), Houston (7th, 19.55 PPG), and Detroit (8th, 19.4 PPG). So, if you do grab some shares of Minshew and he performs well early, you may want to consider selling around his Week 7 bye. He will only get one decent matchup beyond that point.
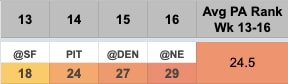
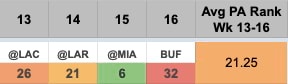
2. Josh Allen – Buffalo Bills
The matchups will progressively get tougher for Josh Allen over the final four weeks of the fantasy season. He also has three road games during this stretch and three games that have the potential for some nasty weather at home against the Steelers then on the road against the Broncos and Pats. I also wouldn’t be surprised to see the 49ers wind up being the toughest defense on this four-game slate despite their rank of 18th. A quick look at some of his performances against these teams last season — Allen finished with 16.4 fantasy points against the Steelers last season finishing as the QB16, 19 points against the Broncos (QB9), and 8.7 points (QB23) at home against the Pats but 20.6 points (QB9) at New England. So, maybe he doesn’t completely bust these weeks, but he’s also probably not someone you’re going to want to trust.
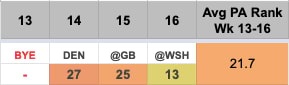
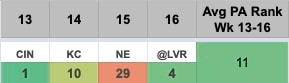
3. Teddy Bridgewater – Carolina Panthers
Teddy might help you get there with the easiest SOS overall this season, but it’s a bit premature to consider him a fantasy savior for 2020. First of all, he’s really not going to help you seal the deal into the playoffs while he’s on a bye in Week 13. Then, his matchups in Weeks 14-15 won’t do much to help carry you to the championship round. If you do make it to the final round in Week 16, he gets a trap matchup against the Redskins who feel like a team that should have allowed a lot more than 18.5 PPG over the last two seasons. Pairing Teddy with someone like Philip Rivers could pay off well though for a late-round match. Bridgewater’s only tough matchups through the fantasy regular season are Weeks 3, 6, and 12. Rivers gets the Jets Week 3 (12th, 18.8 PPG) and the Bengals Week 6 (1st, 21.05 PPG). Week 12 would be the only week you don’t have an ideal matchup for either, then we know Rivers has a pretty cake schedule for the playoffs ranking second best.
T-4. Jarrett Stidham – New England Patriots
There’s probably no tougher team to predict for this coming season than the New England Patriots, and their questionable QB situation is at the heart of that. We’re under the assumption at this point that they’re rolling with Jarrett Stidham under center, though that could change any day with the signing of a vet. No matter who is under center, the schedule this season isn’t going to give them much to work with. They rank 21st on the season as a whole but get a particularly tough stretch over the fantasy playoffs. They get three road games in a row and their best matchup over this stretch is against the Dolphins who they have actually randomly struggled against on the road in the past even when they had Brady as they’ve lost five of their last seven games there.
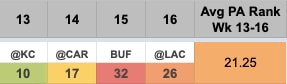
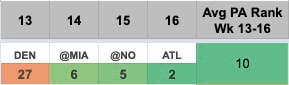
T-4. Drew Lock – Denver Broncos
We already discussed Lock’s gracious schedule as he gets the third easiest SOS overall this season. Unfortunately, if there was one part of his schedule you might want to avoid, it’s this part during the most important stretch of games for fantasy managers. He gets three road tilts and his only home game during this stretch could be an extremely low-scoring affair against the Bills. Lock has mostly great matchups between Weeks 9-13, so if he’s performing well, you probably won’t get a chance to flip him via trade. Just keep in mind on draft day that you may want to target one of the guys mentioned above with a much easier SOS come playoff time.