
Fantasy Football Beneath the Surface
It is said that “looks can be deceiving.” The same can be said for surface-level statistics in fantasy football. During the 2022 NFL season, this weekly article series looked beneath the statistical surface, beyond the standard box score, using the premium statistics provided by FantasyData, including advanced and efficiency metrics across the fantasy skill positions, to search for puzzle pieces that fit together. I will be continuing the “Beneath the Surface” series with multiple articles during the 2023 offseason both looking at some historical statistical trends and recapping the 2023 season from an advanced stats angle.
Metaphorically, the “Bell Cow” RB is on the fantasy football endangered species list. In 2006, seemingly out of nowhere, Chiefs RB Larry Johnson was handed the ball 416 times over the course of one season. Johnson did have 369 rush attempts in 2005 but never exceeded 200 carries for the rest of his career after 2006. From an RB volume standpoint, 2006 stands out because not only did Johnson set the single-season rush attempt record with 416, but it was also the last time an RB cracked the 400-carry threshold. A few RBs have come close since then, including DeMarco Murray in 2014 (392) and Derrick Henry in 2020 (378). Henry is the only active RB in the NFL to ever have come anywhere close to that number. Henry is also one of the last remaining true “Bell Cow” or “Workhorse” RBs, terms I will define more specifically later in this article.
2006 is also the year my fantasy football career began. My home redraft league at the time was a standard-scoring format, awarding no points for receptions. So, early on, I didn’t care much about RB receiving work. I now know the importance and the ceiling (and floor) RB receiving output can provide. So, let’s look through this same surface-level lens using touches (rush attempts plus receptions). It is roughly the same story. Johnson holds the second-highest single-season touch record (457) from that 2006 season, behind someone named James Wilder, who had 492 touches with the Buccaneers in 1984 (before my time). Even with receptions added to the mix, you don’t need to increase the threshold to see how rare these monster volume seasons have become. Since 2006, there have only been four RBs with 400+ touches in a season:
- DeMarco Murray (449 in 2014)
- Chris Johnson (408 in 2009)
- LeVeon Bell (406 in 2017)
- Christian McCaffrey (403 in 2019)
If you lower that threshold to 380 touches, the list of players does grow, but this first point is clear. There were significantly more 400+ touch RB seasons in 2006 and earlier than there have been since. Not yet having provided a more quantitative definition of a Bell Cow, it still goes without saying that these 400+ touch RBs are at the top of Workhorse Mountain. This leads me to the main purpose of this article. Only looking at the top of the list (and only looking at total touches for that matter) leaves out some important details. Volume is king, but in discerning how the RB position has changed in the NFL over the last 16 years we must also look at trends in RB market share statistics. Rush attempts, targets, and touches per game are important, but what percentage of a team’s RB rush attempts, targets, and touches those per game numbers comprise are crucial in deciphering this perceived shift. In general, I use a baseball comparison. There used to be significantly more complete games by Major League Baseball (MLB) pitchers, where one pitcher would much more regularly pitch all nine innings in a game. Nowadays, a complete game barely ever happens, and there are multiple roles filled by multiple pitchers on each team to get through nine innings.
This article will look at the historical trends of RB volume and market share since 2006 while also shedding light on an important follow-up question: What has been the impact on fantasy football? Specifically, the impact on RB fantasy scoring. It seems logical to hypothesize that if RB volume & market share has decreased and been spread around to a larger group of RBs, then the scoring of fantasy points by RBs would follow the same trend. But has that been the case?
Study Parameters
For this study, I used the Top 24 RBs in fantasy points per game (PPG) in each season from 2006 through 2022. The seasonal Top 24 groups are based on Points per Reception (PPR) scoring, a minimum of eight games played, and the statistics from the final week of each season were not included as the majority of fantasy leagues do not play the final week. With the RB pool determined based on fantasy points leaderboards over 17 seasons, I then selected the following metrics to look at for each RB in each season. Each of the market share statistics is on a per-game played basis, meaning missed games were not counted against the RBs.
Volume Statistics:
- Touches Per Game (Tch/Gm)
- Rush Attempts Per Game (RA/Gm)
- %Opportunities from Rushing (%OppRu)
- %Opportunities from Receiving (%OppRec)
- Number of RBs per season with 20+ Tch/Gm
- Number of RBs per season with 17+ RA/Gm
Market Share Statistics:
- Opportunity Share (% of team’s total RB rush attempts plus RB targets; Opp%)
- RB Rush Share (% of team’s total RB rush attempts; RA%)
- Target Share (% of team’s total targets for all pass catchers; Tgt%)
- Number of RBs per season with 70%+ Opp%
- Number of RBs per season with 65%+ RA%
- Number of RBs per season with 12%+ Tgt%
Fantasy Scoring
- Average PPG trends
Within each season, I then averaged these metrics across the Top 12 RBs, RB13-RB24, and the combined Top 24 RBs, as I wanted to see what the trends have looked like for both the RB1s and RB2s each season and on average. This was done for each season’s Top 24 RBs, 2006-2022. Here is an example of what the data set looks like from 2022:
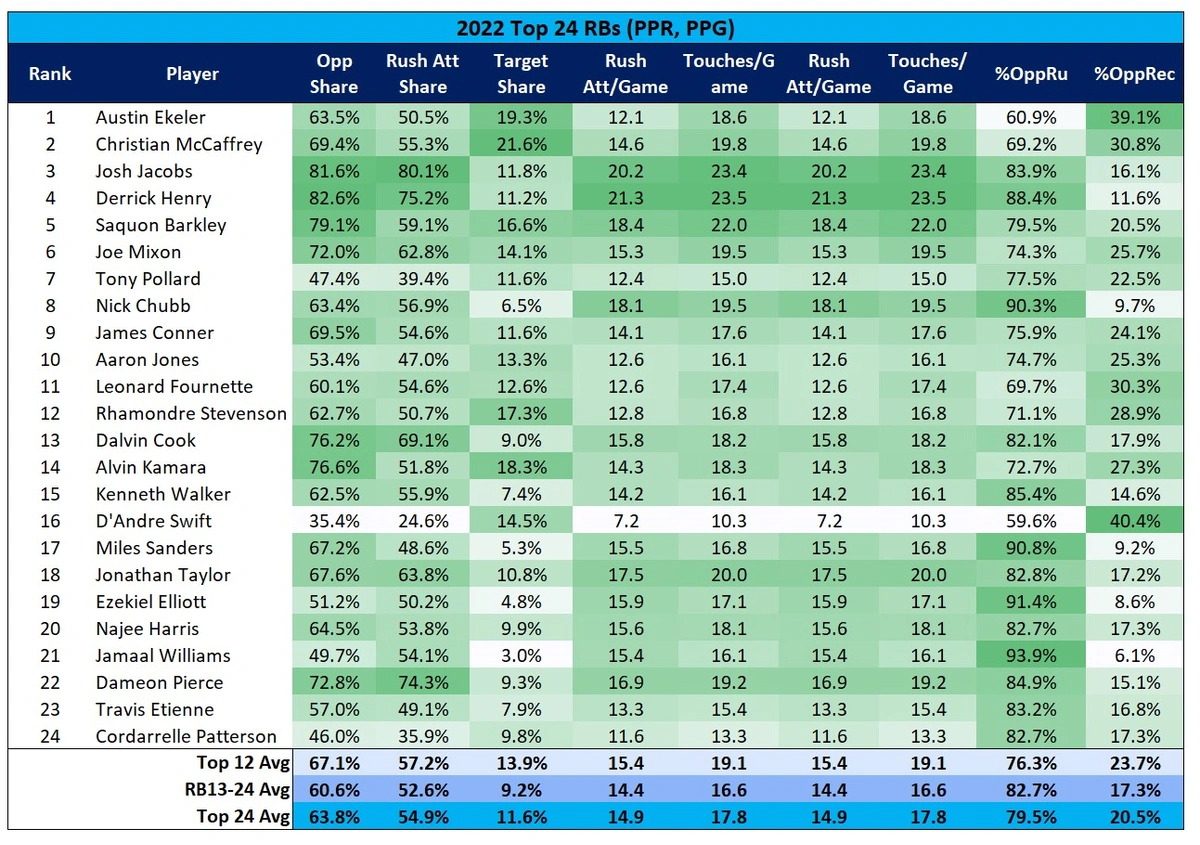
Slight spoiler alert. You can see from the 2022 data the clear trend with the type of RB opportunities. The Top 12 is loaded with higher receiving output ratios while the opportunities for the RB13-RB24 RBs were 80%+ rushing output on average. This is not a revelation. This has often been the case recently, and why Nick Chubb, while arguably one of the best (if not the best) pure RBs in the NFL has not realistically had overall RB1 in his range of outcomes. It is also why Derrick Henry and Josh Jacobs are relative outliers and are so valuable. They give you the steady Workhorse consistency and threaten for the RB fantasy points crown even lower-end receiving numbers.
So, what have all these metrics looked like over the last 17 years? Generally, receiving output has increased for RBs while rushing output has decreased. But what about some of the individual metrics, such as target share? Initially, it seems logical that average RB target share would have increased for RBs along with receiving output. But is that true?
In looking at the seasonal averages, I chose a point to further separate the data. Looking only at a 17-year average with this type of data can mask the trends that matter to us as fantasy managers: The recent or current trends. The NFL looked different in 2006 compared to today (see 400+ carry discussion above). For many of the rushing metrics, 2006 was the high-water mark and the endpoint of a multi-year peak. The rushing numbers largely have not approached that 2006 level since. Another spike occurred in 2012 followed by a markedly rapid decline that bottomed out in 2015, which was the low point in general RB usage and RB fantasy scoring. And finally, the numbers have been creeping back up since 2015. I chose 2012-2013 as the breakpoint, creating two smaller ranges from which to view the data and compare:
- Range 1: 2006-2012
- Range 2: 2013-2022
- Range 3: 2016-2022 (later in the article)
Near the end of the article, I will show what the fantasy points scoring has looked like over these same ranges, and I will show the most recent trends from 2016 through 2022, which are surprisingly strong and go a long way in answering an important question: Have the gradual decline of the traditional Workhorse/Bell Cow and the shift in how RBs are utilized been a negative thing for fantasy football? Depending on how you currently view fantasy RBs, the answer may surprise you.
RB Volume Trends
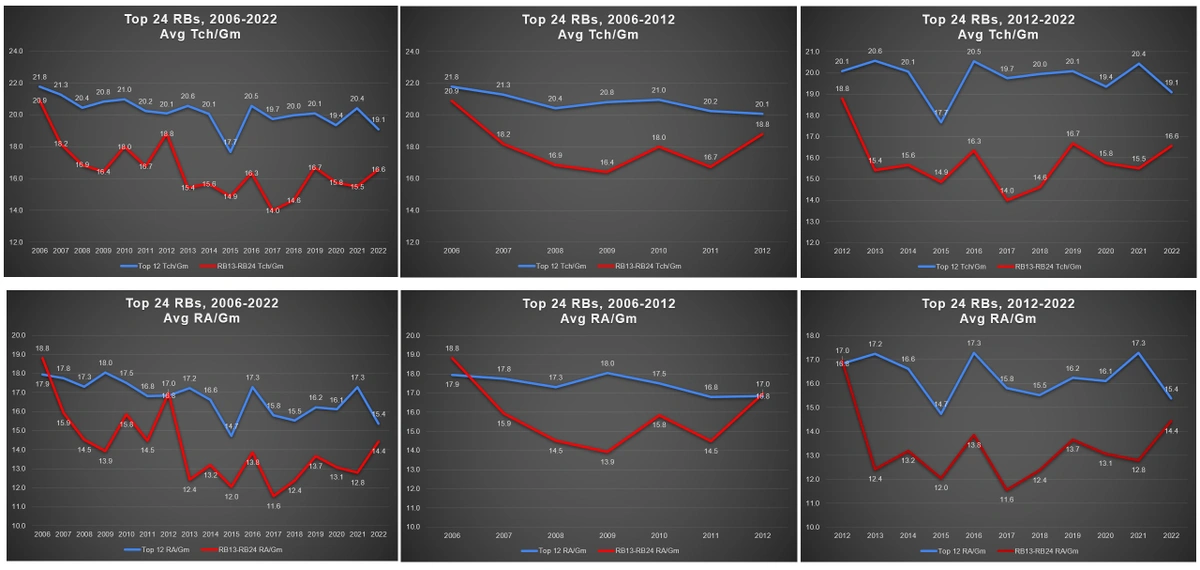
Starting with volume statistics, the following table shows average touches per game (Tch/Gm) and rush attempts per game (RA/Gm) for the Top 12, RB13-RB24, and Top 24, with the averages broken out over Range 1, Range 2, and the full duration, 2006-2022. Following the table are graphical representations of the data for the three ranges (2006-2012, 2013-2022, and 2006-2022).
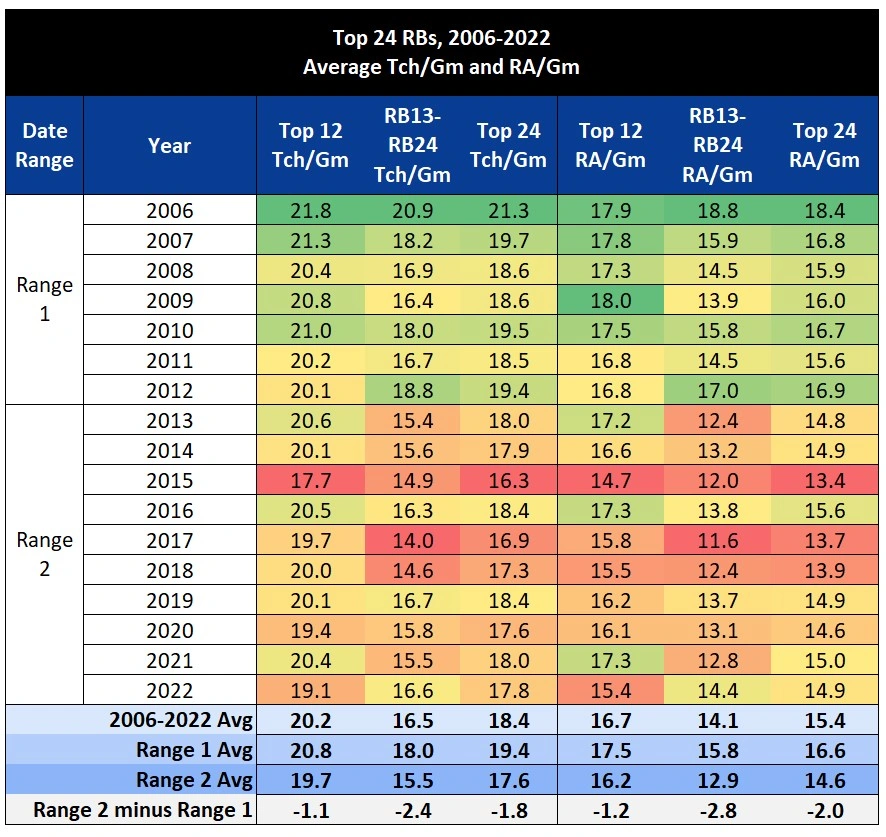
Here you can see what the 17-year average does. The 17-year average Tch/Gm for Top 12 RBs is 20.2, only 0.4 Tch/Gm higher than the more recent Range 2 (19.8). But if you compare Range 1 (20.9 Tch/Gm) to Range 2 (19.8), it’s over one Tch/Gm higher. It is the same for the RB2 group and the same when looking at RA/Gm. The trend is clear (and not a pioneering take). Looking at the 10-season average of Range 2, per-game rushing volume numbers have decreased especially for the RB2s. Outside of the 2015 negative spike year, the average Tch/Gm and RA/Gm for Top 12 RBs has remained steady. So, the initial view shows that the historical trend we’ve seen has impacted the RB13-RB24 group more significantly than the Top 12.
Looking at averages only shows us the direction of a potential trend. To get a little closer to something more fantasy relevant (and less obvious), I chose some “total number of RBs” thresholds and simply counted how many RBs in this data pool were above or below the thresholds each season. The thresholds are somewhat arbitrary but represent something approaching Bell Cow volume:
- Tch/Gm: 20.0
- RA/Gm: 17.0
It is helpful seeing the number of RB1s and RB2s to reach these elite per-game volume numbers over time.
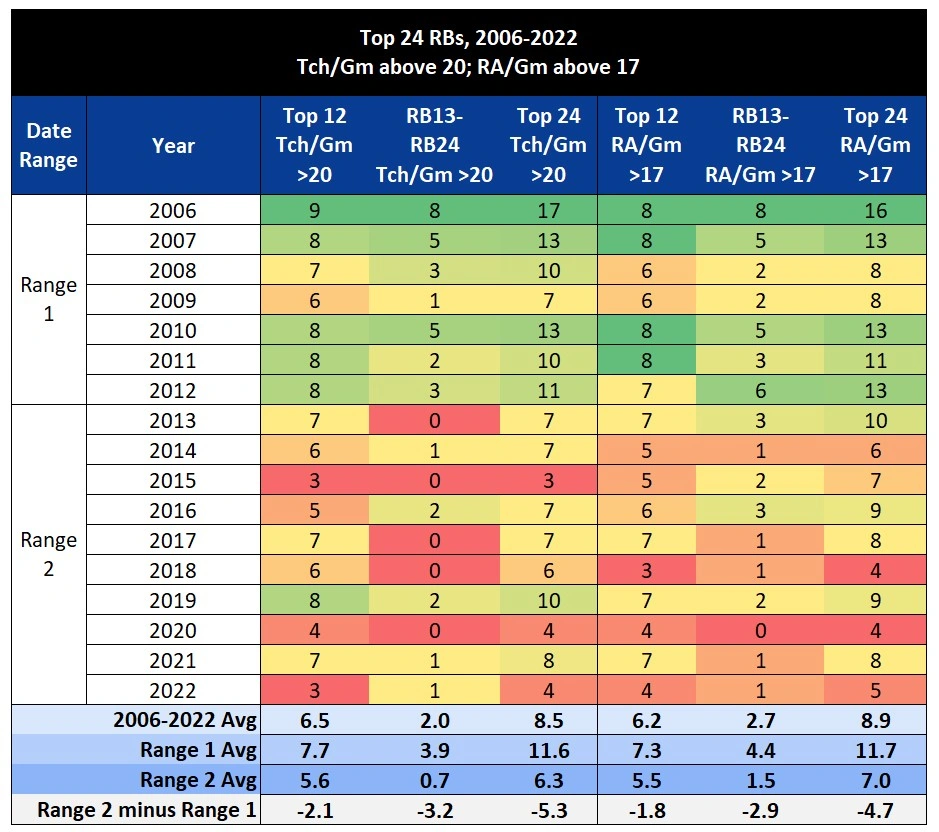
It is from this total RBs angle that the decrease in Workhorse RBs is most pronounced, at least using the more traditional rushing volume to define “Workhorse” (more on that later). In 2006, there were 17 RBs in the Top 24 who averaged 20+ Tch/Gm (70.8%). In 2022, there were only four (16.7%). I know we aren’t comparing in that manner, but the significance of that drop is difficult to ignore. Looking at our comparison between Range 1 and Range 2, there have been 5.3 fewer RBs per season averaging 20+ Tch/Gm compared to Range 2, and 4.7 fewer RBs averaging 17+ RA/Gm in the same span.
Another lens for volume is the type of volume, or, more accurately, the rushing-receiving ratio. For this, I looked at the percentage of RB opportunities from rushing (rush attempts) and from receiving (targets).
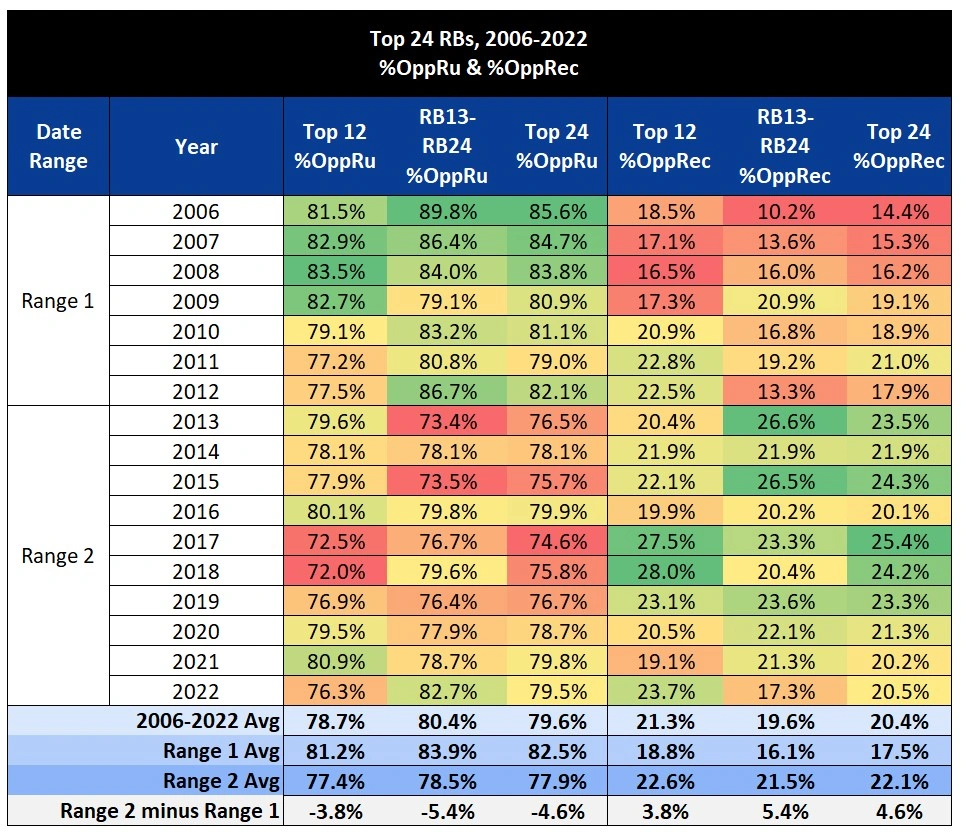
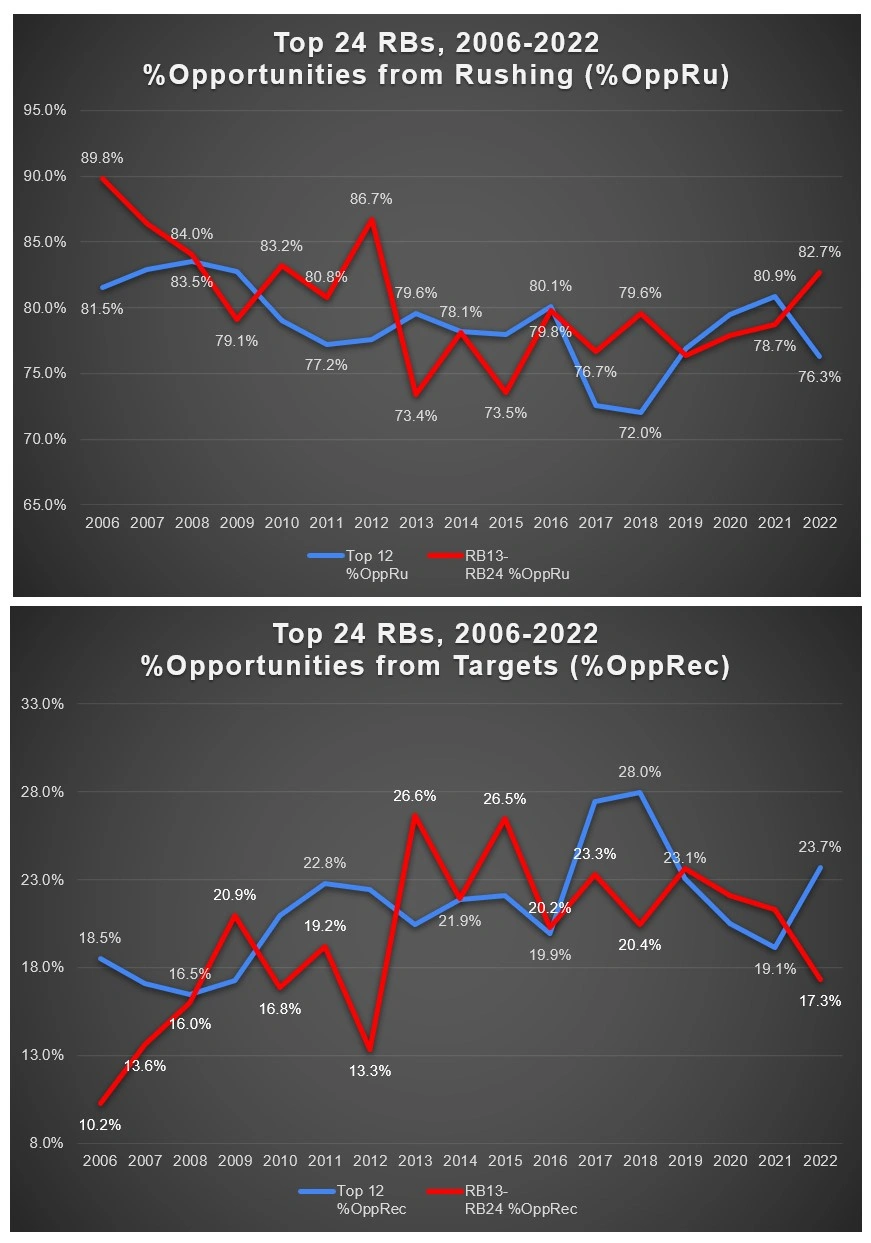
Different rushing metrics but the same story. When comparing Range 2 to Range 1, the %OppRu decreased by 3.8% for Top 12 RBs and decreased by 5.4% for RB2s. However, we do have our first metric so far that increased from Range 1 to Range 2. But that’s because it had to. When two percentages add up to 100%, if one decreases, the other must increase by the same percentage. The %OppRec increased by 3.8% for Top 12 RBs and increased by 5.4% for RB2s.
Again, the purpose of this article is not to pass off the fact that RB volume has decreased as some sort of revelation. Rather it is to confirm that fact and shed light on the degree to which it has declined by showing the quantitative data. With that comes sub-trends that are not as obvious. Such as the fact that the decrease has been more pronounced with RB2s. Top 12 RBs have been, on average, closer to pre-2013 volume levels than RB2s.
RB Market Share Trends
Another crucial piece of this story is market share statistics. Volume tells us a lot, but adding the context of what chunk of the teams’ offense the volume has represented is important. Using the same date ranges, the following table shows the average Opportunity Share (Opp%), Rush Attempt Share (RA%), and Target Share (Tgt%) for the Top 12, RB13-RB24, and Top 24, with the averages broken out over Range 1, Range 2, and the full duration, 2006-2022. Following the table are graphical representations of the data for the three ranges.
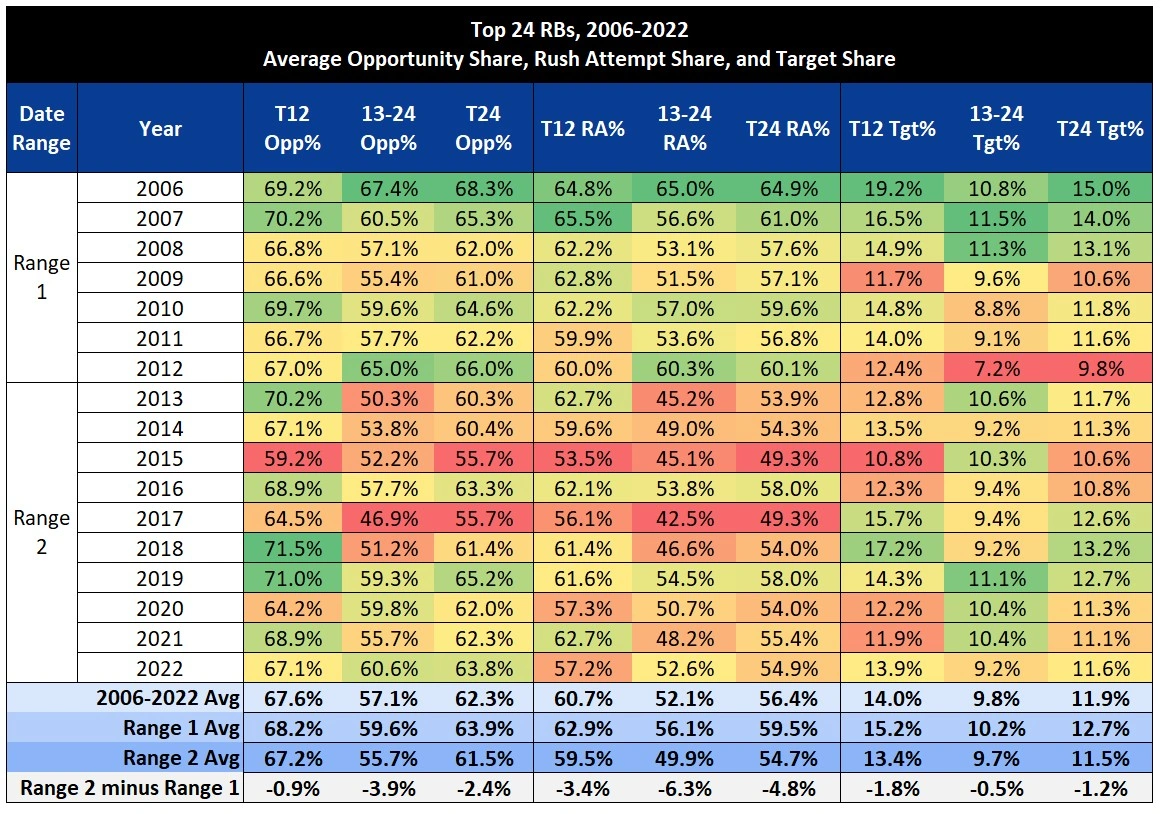
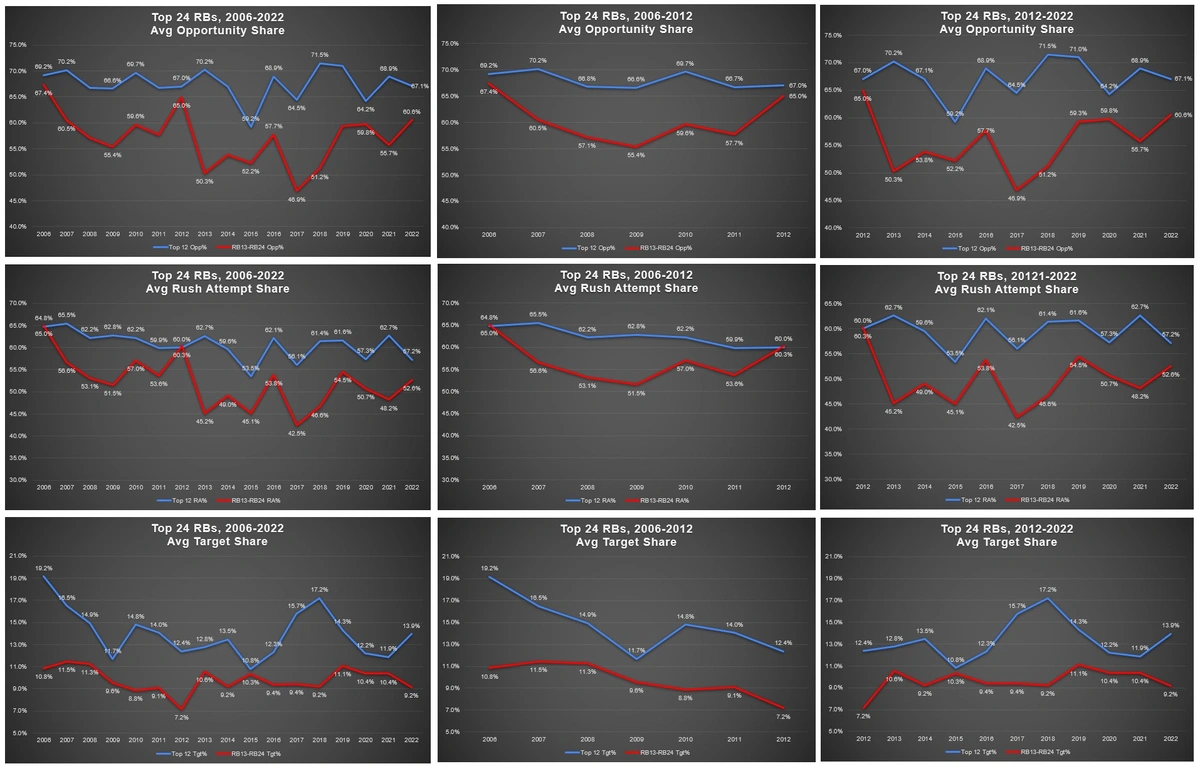
As with the volume metrics, you can see the issues with comparing the more recent Range 2 to the full 17-year averages. The difference is much closer than when comparing to Range 1 because Range 2 is included in the 17-year sample size, so the Range 2 numbers help to bring down the 17-year average, therefore, making the difference smaller. And we see similar results with the market share statistics. With Opp% and RA%, the averages are lower between Range 2 and Range 1 across the board, with the most significant difference being with the RB2s. The surprising result here (and an answer to a question posed at the beginning of the article) is with Tgt%. We have already seen that the one volume metric that has increased since 2012 is the %OppRec (% of an RB’s opportunities coming in the form of receiving targets). But average Tgt% has actually decreased between Range 1 and Range 2. However, I believe this is more to do with the specific date ranges selected. The graph showing 2006-2012 has an obvious negative trend. But, target shares were so high in 2006 and 2007, especially for the RB1s that skews the overall trend. Also, Range 2 has included more of a roller coaster “peaks and valleys” trend with RB Tgt%. So, while our “Range 2 minus Range 1” equation still shows an overall decrease in RB Tgt%, I believe this is more due to the volatility of the metric rather than an indicative trend. For instance, the third-lowest average RB1 Tgt% occurred recently in 2020 (11.9%), while the highest since 2006 occurred only three years prior (17.2%).
With market share statistics I also looked at some “total number of RBs” thresholds and counted how many RBs exceeded the thresholds in each season. The following thresholds were used:
- Opp%: 70%
- RA%: 65%
- Tgt%: 12%
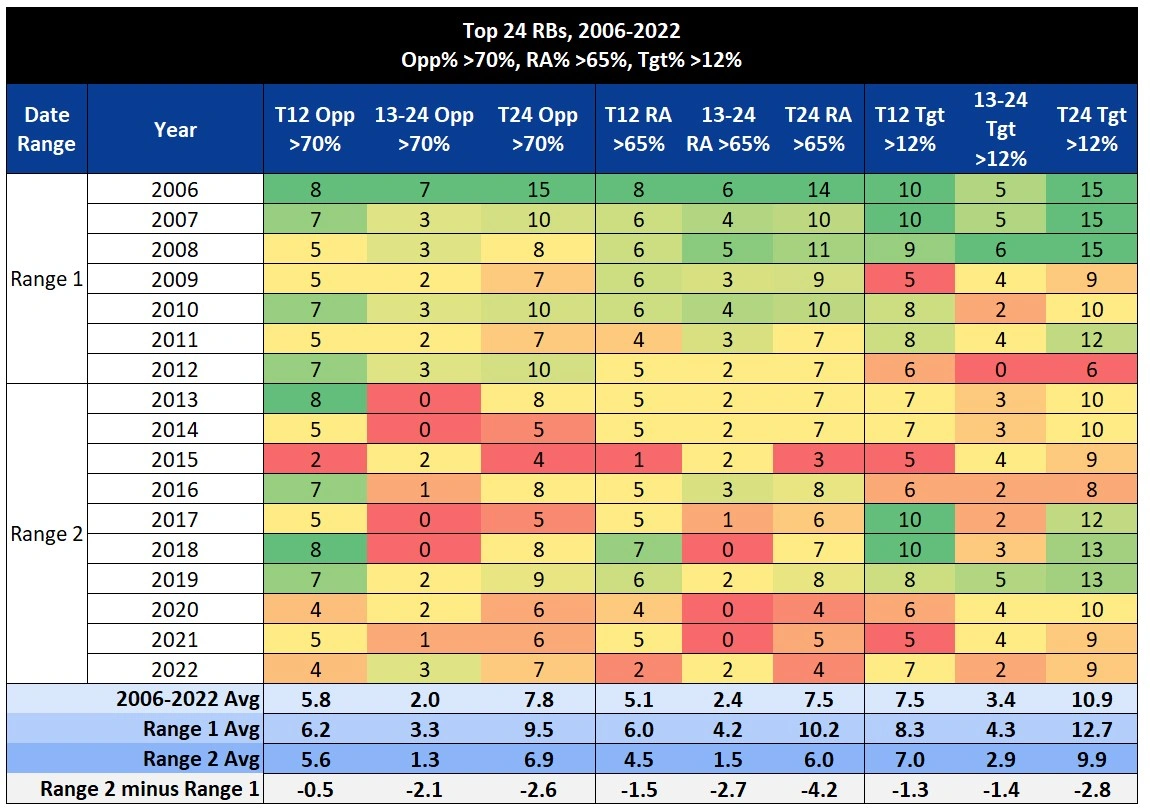
While not quite as drastic as the “total number of RBs” volume thresholds, the same downward trends are shown, including Target Share. One thing this study taught me is I did not realize how many RBs had solid Target Shares in the late 2000s.
The historical data confirms what should not be surprising. RB volume and share of their team’s offensive markets have declined, looking both at average numbers and the total number of RBs reaching certain statistical thresholds each season. So RBs have become less valuable in fantasy football, right? On average, they are scoring fewer fantasy points, right? Not so fast.
RB Fantasy Scoring
I am an optimist. I like positive things. So, this portion of the article was my favorite discovery. Yes, there are fewer Bell Cow/Workhorse RBs (using the more traditional rushing output definition) than there used to be. You see it daily in the fantasy football space, the dreaded addition of an RB to a backfield with someone’s favorite RB or hot take sleeper RB. I am not sure if this is a residual effect, but it seems when the potential of an RB receiving a Bell Cow role is dashed, whether it ever made sense for that RB to be a Workhorse, panic ensues. But should it? With these volume and market share decreases, more shared backfields, and more specialized RB roles, are we worse off than the days of 400+ RB touches? Well, if you look at the average PPR PPG by RBs over the same date ranges, you will see that the answer is no.
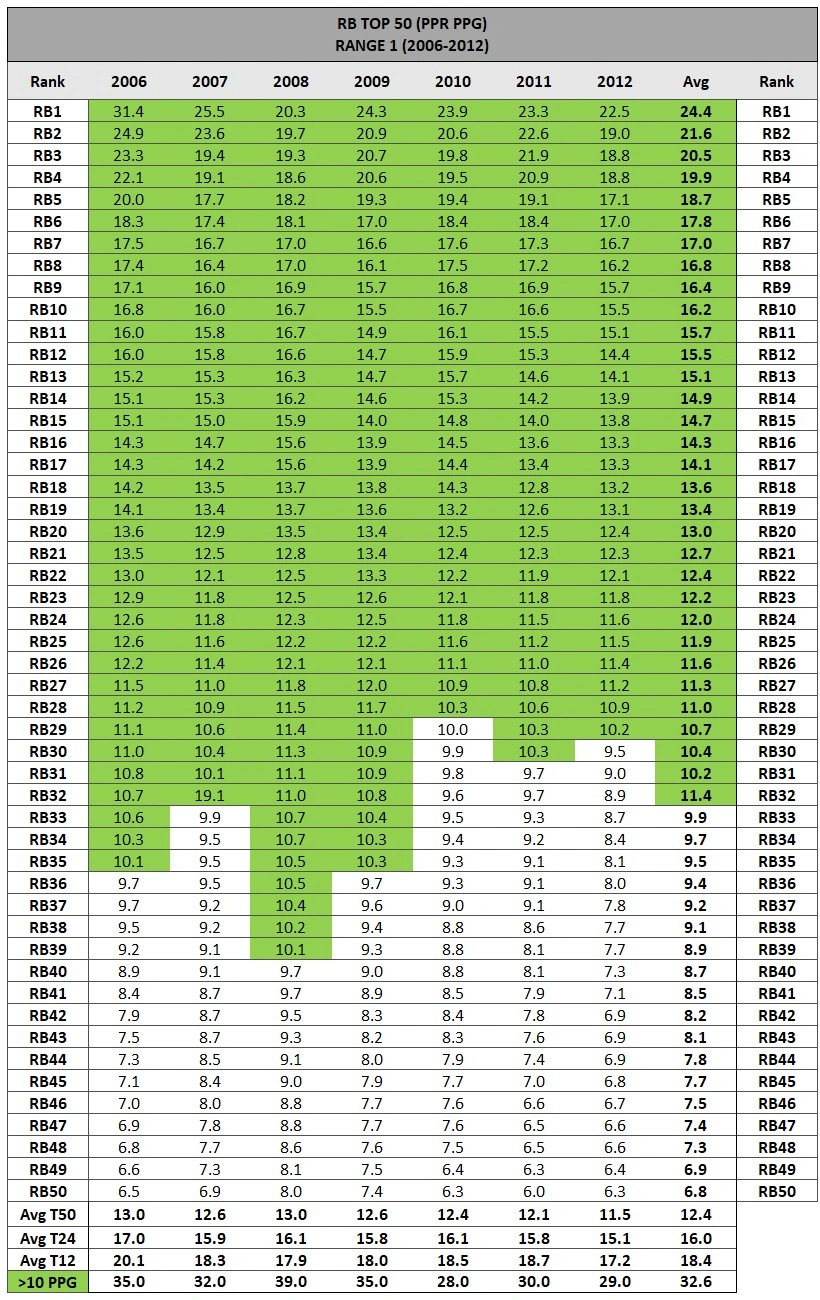
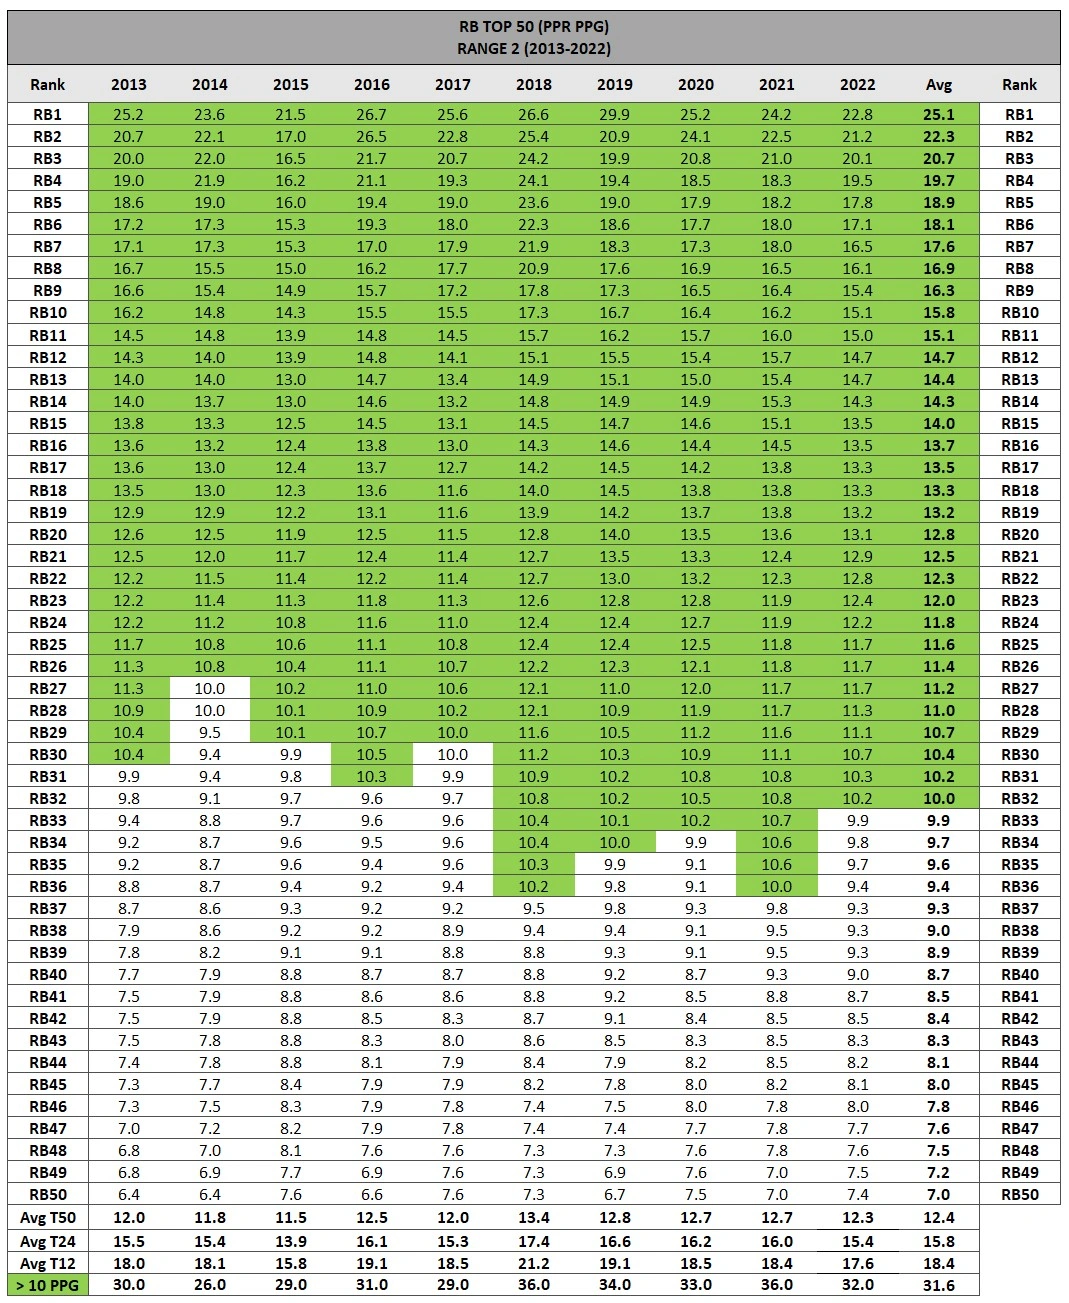
For this, I started by compiling the PPR PPG for the Top 50 RBs from 2006-2022. I wanted to arrive at multiple different averages to use for comparison within the different date ranges:
- Top 50 average PPG (each season and across the date ranges)
- Top 24 average PPG (each season and across the date ranges)
- Top 12 average PPG (each season and across the date ranges)
- Number of RBs >10.0 PPG each season (and average per season across the date ranges)
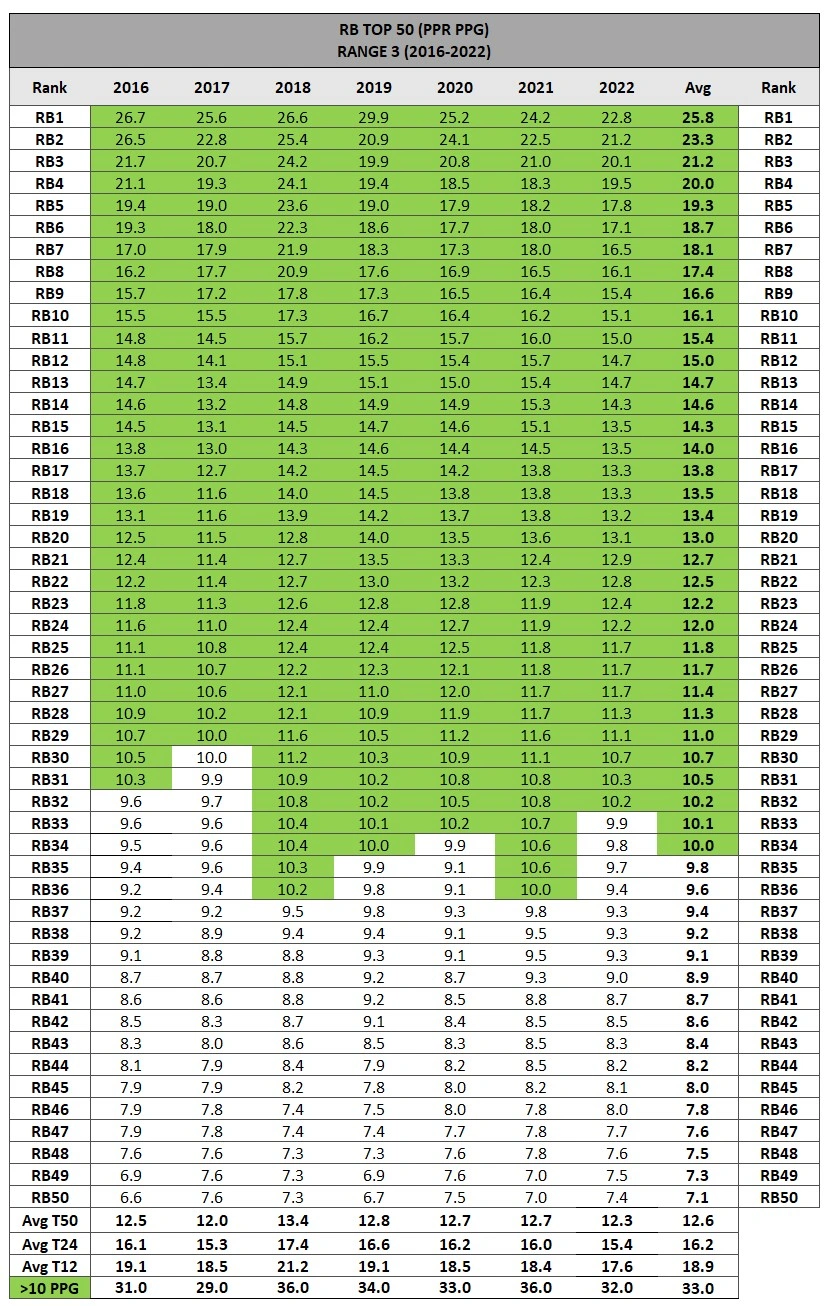
Along with these I also looked at the average PPG for the RB1, RB2, RB3, and so on down to the RB50 from 2006-2022, then looked at that same average using Range 1 (2006-2012), Range 2 (2013-2022), and, for the fantasy points portion of the article, Range 3 (2016-2022). I included this third and most recent range because 2015 was such a down year. 2015 represented a significant downward spike across most of the metrics looked at in this article. So, rather than just removing 2015 from the Range 2 data set, I decided with fantasy points to introduce Range 3.
The following are the Top 50 PPG raw data tables for Range 1, Range 2, and Range 3:
And now for the grand finale. Here are the average PPG numbers as described above organized in the same manner as the volume and market share averages above, but with Range 3 included:
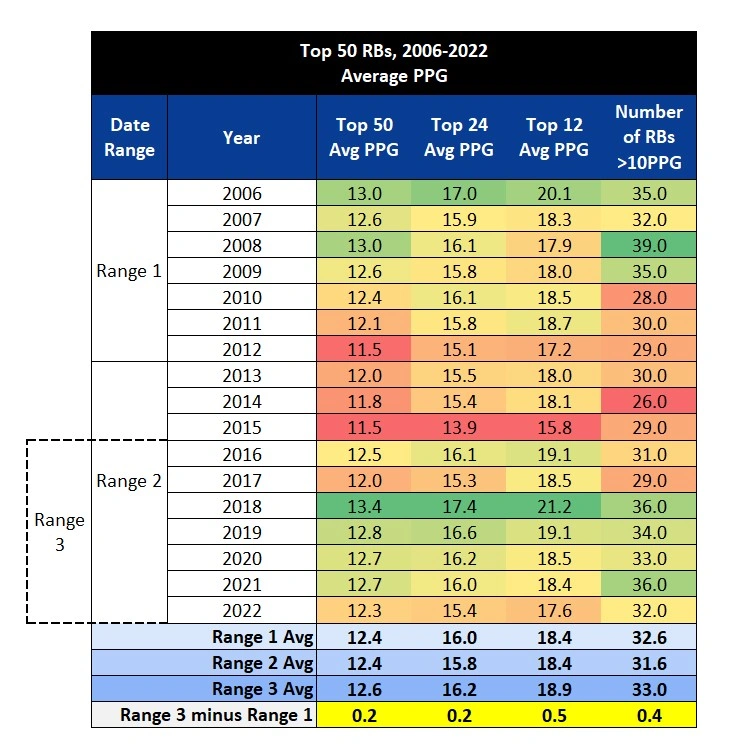
You can see the reason for my optimism. While not massive differences, the differences in PPG averages between Range 3 and Range 1 are positive. Whereas Range 1 dominated the RB volume and market share trends, over the last seven years (Range 3), RB fantasy scoring has been higher. The average PPG of the Top 50, Top 24, and Top 12 RBs have been higher, and more RBs within the Top 50 are scoring 10+ PPG. The RB landscape in the NFL and fantasy football has changed, but when it comes to fantasy points, it has changed for the better.
Thanks for reading! If you have any questions about the data presented in this article or about fantasy football in general, feel free to hit me up on Twitter @MunderDifflinFF.
Fantasy Football Articles Emailed to You
Enter your email address and get all of FantasyData’s latest Fantasy Football content, promotions, and giveaways sent to your inbox!