Welcome to the tight end edition of the 3 Year ADP Grade vs Final Fantasy Rank series!
Every season fantasy fanatics everywhere have cheat sheets they like to put together. Some prefer to buy them, some spend hours, days, and weeks pulling data and tweaking numbers until they get a system they are mostly happy with. This season, I decided to take my cheat sheet one step further and offer it up here at FantasyData for everyone to use. I have torn apart our historical ADP data along with our stats and season leaders tools to give a unique look at each position. We are going to use a three-year sample size here and compare average draft positions (ADP) vs final ranks (FR) to see which players commonly under or overperform each season. We’ll also look at points per game (PPG) totals and ranks to hopefully give you a completely zoomed out, unbiased look at past performances and how they relate to each player’s 2019 ADP. If you are into the value-based drafting (VBD) strategy or just prefer a more risk-averse approach on draft day, this is your dream sheet.
My goal with providing this information is also to eliminate too much forward-looking opinion and look purely at what has happened and then that gives you a jumping-off point to decide for yourself where things will go in 2019. Yearly consensus ADPs are a great indicator of popular opinion, but we will also look here at how often past ADPs have been accurate for each player. I will still give some notes on players that really stand out to me based on this info. I should also mention that since we are looking at three-year samples here, rookies and second-year players won’t be included. This is a lovechild of mine that I have spent countless hours on, I hope it helps you better prepare for fantasy drafts this season!
Quick Glossary of Primary Columns
- 2019 ADP vs 3Y ADP Diff: 2019 Average Draft Position vs Three-Year Average Draft Position Differential (column AX)
- 3Y ADP/FR Diff: Three-Year Average Draft Position vs Three-Year Average Final Rank Differential (column AY)
- 2019 ADP vs 3YAFR Diff: 2019 Average Draft Position vs Three-Year Average Final Rank Differential (column AZ)
Other 3 Year ADP Grade vs. Rank Articles
2019 ADPs vs Three Year ADPs
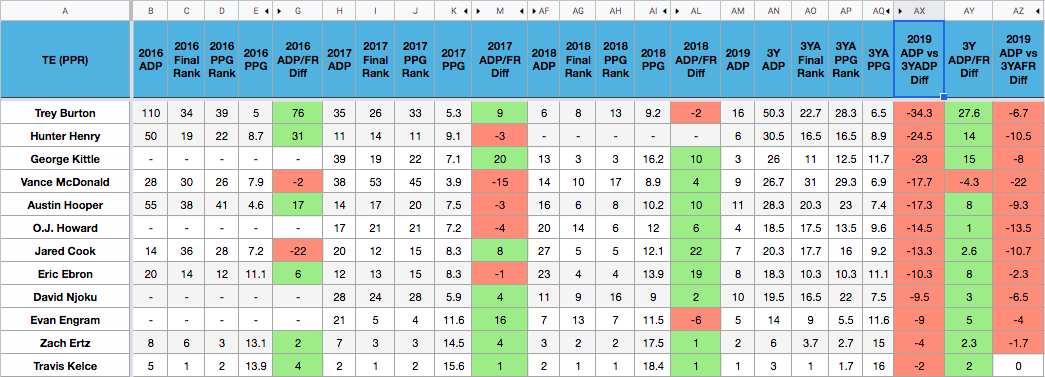
First up here we are going to look strictly at ADP data to see where each player’s 2019 ADP compares to their ADP over the last three years (column AX). This helps us see whose value is higher or lower this year compared to their average and a good starting point to find value.
Positive Value Plays
Generally speaking, a player who is green in the first column but red in the other two are cheap this season for a reason. This means that they haven’t lived up to their ADP over the last three years on average and that their 2019 ADP is higher than their three-year average final rank which implies that they would have to score more fantasy points this season than they have over that span on average. Green across the board for these guys implies a solid value and likely a low-risk play at their current ADP.
Another good way to formulate an opinion on these guys is to look at each individual year and see how they’re trending. Delanie Walker, for example, lost pretty much all of last season so this sunk his average. Before that, he was a solid play and I personally love his value late in drafts this season.
A formidable trio of oft-injured players leads the way here in top ADP value with Tyler Eifert, Jordan Reed, and Greg Olsen. Each of these guys has offered some value when healthy over the last three years, but those moments have been few and far between. If you want to take the risk on one of these guys, Jordan Reed offers the most value as he has been the closest to actually hitting his ADP over this span and his 3YA PPG rank (column AP) actually registers in the top eight. His 14 PPG total in 2016 was the best amongst all TEs.
The best values in fantasy drafts this season are guys who light up green across the board. Their value is relative to their 3YA final rank, so that is something to keep in mind. We have three cases of that here with Jimmy Graham, Jason Witten, and Kyle Rudolph. Graham is a good case to look at each season’s individual trend. His decline is evident in his ADP/FR differential in 2017 (-1) and then 2018 (-8). Considering he is being taken above Rudolph and Witten, I would prefer the latter considering they each have positive individual season values.
Kyle Rudolph is a player I have loaded up on heavily in fantasy. He hasn’t been flashy like Travis Kelce or Zach Ertz with his numbers, but at the end of the year, he has been reliable. Rudolph’s 3YA final rank is third-best over this span behind only Kelce and Ertz and he has finished inside the top-eight each season with a ceiling of TE2 in 2016.
Jason Witten is another guy who has a career track record of being an incredibly consistent source of fantasy points in PPR leagues. Witten was inactive last season botching play calls from the booth, so he figured, why not get back on the field and give it another go? Before last season, Witten was undervalued in both 2016 and 2017 and is even more so this season. I think there is plenty of potential for him to still squeeze out a top-ten performance this year. For TEs it really just comes down to average production in a full 16 games to finish top 12. This is what we have gotten from both Witten and Rudolph.
Jack Doyle’s health was a problem last season which has sunk his averages, but as we can see here he still provides positive value despite that for the most part. He was top 10 in PPG when healthy last season despite sharing the field with Eric Ebron. If both Doyle and Luck and remain healthy this season there is plenty of potential for Doyle to return plenty of positive value at his current ADP.
Negative Value Plays
You’ll notice a trend with a lot of the negative value plays here that each is basically coming off a breakout last season. The only two who didn’t return value on their ADP last season from this sample were Trey Burton and Evan Engram. Burton comes up as the riskiest based on his 2019 ADP, but that is also primarily because he wasn’t a starting-caliber TE back in 2016 or 2017 which sinks his 3Y ADP value. He still managed to finish top eight last season, but people aren’t paying for it.
People are paying for Hunter Henry to make a big jump this season sans Antonio Gates. I understand the potential for a big year, but there is a ton of risk here that isn’t being built into his ADP.
The same could be said for Vance McDonald. People are blinded by the available targets in Pittsburgh and McDonald’s TE10 finish last season, but what I see as a red flag here is that he only ranked 17th on a PPG basis. There are also health concerns with him and the potential of an entire offensive regression with the Steelers offense a year after Ben Roethlisberger had both a career-high and league-high 675 pass attempts at age 36.
Austin Hooper, O.J. Howard, Jared Cook, Eric Ebron, and David Njoku are all players who have consistently trended up each of the last three years (two in some cases). This rise is reflected in their 2019 ADPs as people continue to buy them higher than their average. Of these guys, Howard is the only one who is being bought higher than his final rank last season. So you are paying for a big, full season breakout with him whereas there is some regression built into each other player’s ADP. This is a little bit of a red flag for Howard. A best-case scenario based on the data here would have Howard’s ceiling at TE6 based on his 2018 PPG rank. Conversely, Njoku had a PPG rank of only TE16 last season despite a final rank of TE9. This kind of goes back to where I see risk with Vance McDonald in the fact that their PPG isn’t nearly as impressive as their final ranks.
Three-Year ADP vs Final Rank Differential
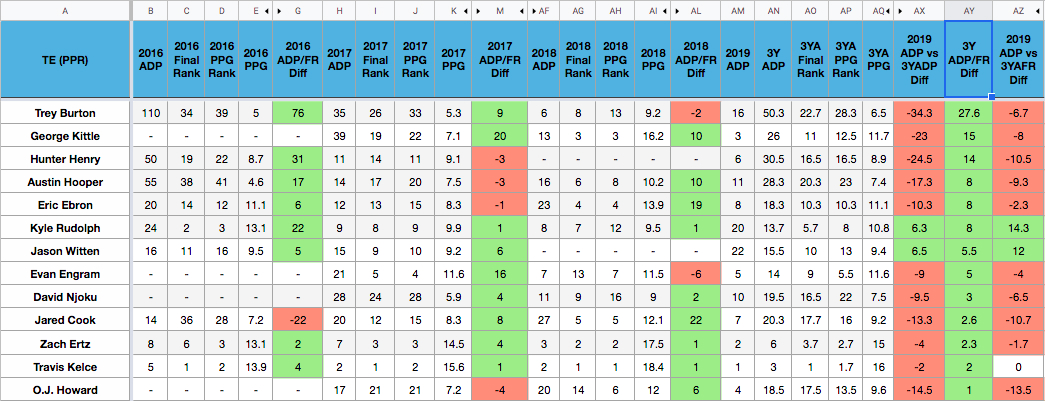
This is kind of the meat of this research and we already kind of touched on it above, but this is where we see who has had an average final rank above or below their ADP over the last three years on average. We are filtering column AY here by positive and negative values to get this.
Positive Value Plays
As we eluded to earlier, Trey Burton’s averages are a little skewed based on his lack of usage early on. George Kittle’s rise shows up well here. The most impressive numbers continue to be Kyle Rudolph and Jason Witten considering their final ranks compared to their ADPs consistently.
Negative Value Plays
The negative plays here we also looked at a little earlier with the injury risks in Eifert, Olsen, and Reed specifically factoring in. Doyle just misses breaking even here by one spot.
2019 ADP vs Three-Year Average Final Rank Differential
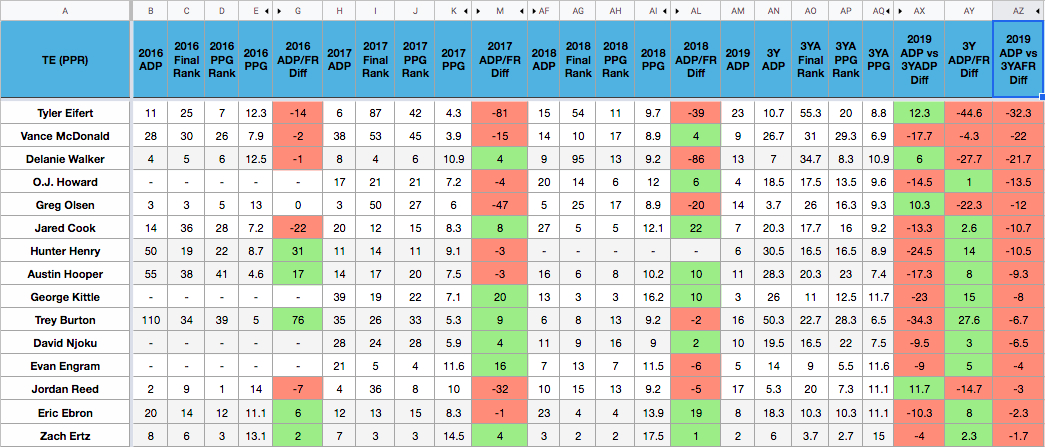
The last column we will filter looks at player’s 2019 ADPs versus their three-year average final ranks. So this is who has the best or worst value at their current ADP compared to their final ranks over the last three years.
Positive Value Plays
This kind of speaks volumes to the disparity at the TE position. A strong reason why so many have begun to lean towards TE premium scoring as well. When you whittle it all down, this suddenly turns into a Kyle Rudolph and Jason Witten hype piece. Not really the intention but this is what past numbers have given us. Jack Doyle is notably filtered out here due to his positive value being less than one point.
Negative Value Plays
So this is basically what everything boils down to. Your 2019 tight end risk-o-meter. The Vance McDonald truthers will say it’s not true, but this is just what past numbers tell us. Obviously with any kind of prediction you can pull all the positive stats you want to say “this is what I think will happen and why,” but what I wanted to focus on more is what actually has happened. This doesn’t mean that Vance McDonald can’t continue his breakout and beat his ADP, it just shows that he hasn’t done that in two of the last three years and he absolutely needs to beat out both his final rank and PPG rank last year to break even on his draft price. It’s a lot to expect from someone so unless you see something that has you completely sold, there are less risky picks later on.
These were just some of my takeaways from looking over all these numbers. I encourage you all to spend some time looking over the PPG totals and things like that more. There are a lot of interesting things you can pull and find like the fact that Travis Kelce has only actually finished first in PPG once in the last three years despite finishing as the overall TE1 each season. I hope this has helped you better evaluate one of the more frustrating positions in fantasy football. Good luck this season!
Dominate Your Fantasy League!
Become a member at FantasyData and get access to the industry’s best fantasy football subscription available!


