Fantasy Football Beneath the Surface
Another week of NFL football, another pile of data to sift through looking for clues. Clues as to what leads to certain results and clues for speculating what might be coming next. They say, “looks can be deceiving.” The same can be said for surface-level statistics in fantasy football. In this weekly article series, I will be looking beneath the statistical surface, beyond the standard box score, using the premium statistics provided by FantasyData, including advanced and efficiency metrics across the fantasy skill positions, to search for puzzle pieces that fit together.
As you have seen if you have kept up on this article series, I like diving into different data sets to search for useful data and trends, but also in an attempt to explain some of the sub-surface metrics; what they mean and why they are important. While I am always trying to uncover and provide actionable data, this article’s theme doesn’t always lend to short-term actionable information, such as the lineup decisions you are making each week. Last week I dove into fantasy football strength of schedule data across the fantasy skill positions, probably the most actionable article I have written so far for FantasyData. While another week of data has occurred, it has not moved the needle much as far as the remaining fantasy strength of schedule. If you would like to read that article you can find it here.
Also as a reminder, some great writers at FantasyData are providing the here-and-now actionable information every week:
- Tony Spahr: Fantasy Football Recap and Overreactions from Week 13
- Matthew MacKay: Start ‘EM Sit ‘EM Week 14
- Bradley Stalder: Fantasy Football Rankings vs. ECR: Week 14
- Ryan Kirksey: DraftKings Cash Game Plays: NFL Week 14
For this article and much of the rest of the season, I will be moving back to my primary theme and focusing on some of FantasyData’s Advanced and Efficiency metrics now that a good portion of the 2022 season has been played.
NOTE: The Week 14 Thursday Night Football (TNF) between the Raiders and Rams is not factored into this data.
QB Advanced and Efficiency Data
I want to spend some time in this article highlighting a few of the advanced/efficiency metrics available at FantasyData starting with the QB position. Some unique statistics add important context to the numbers that show up in the box score:
- Money Throws (Passes requiring exceptional skill or athleticism as well as critical throws executed in clutch moments)
- Accuracy Rating (grades each pass attempt on a scale from 1 (least accurate) to 10 (most accurate))
- True Completion Percentage (Removes dropped passes from the pass attempts denominator of the completion percentage equation)
- Pressured Completion Percentage (Completion percentage when QB is hurried or hit while throwing outside of the pocket)
- Interceptable Passes (Pass attempts within the catch radius of a defender, or deflected into the air in the vicinity of a defender)
Having spent the last month discussing concepts like Expected Points, it is no surprise I am also a fan of Money Throws. They both add game situation context to traditional box score statistics, and Money Throws also factor in skill. Like Expected Points, Money Throws show that not all positive QB plays (e.g. pass completions) are created equal. A 10-yard completion on third and 20 to a wide open check-down option is not the same as a 10-yard completion on third and nine squeezed between two defenders. Both will simply be 10-yard completions in the box score. But, as with most individual metrics, Money Throws are not definitive. Fewer Money Throws do not necessarily correlate to less QB success or fewer fantasy points, and vice versa. Quantifying skill is not as straightforward as quantifying opportunity, efficiency, and production.
There are various places we can look within the numbers in an attempt to identify skill with QBs. Accuracy is one location. You can look at a surface-level statistic like overall completion percentage, which is a good starting point, but it also leaves out important context. For instance, dropped passes count against the overall completion percentage. True Completion Percentage and Accuracy Rating. Completion percentage metrics are generally helpful, with another FantasyData advanced data point approximately aligning with Money Throws: Pressured Completion Percentage (a QB’s completion percentage while being pressured by the defensive pass rush).
Another more indirect indicator of skill is a lack of turnovers. Interceptions or the lack thereof are comprised of a variety of combined factors. Vision, reading the defense in front of you, decision-making, and execution all play a role in whether an attempted pass results in a turnover or not. Exactly which factor or combination of factors causes the negative play varies, but the Interceptable Passes metric is more useful than raw interceptions because it more accurately conveys what is happening. Plenty of turnovers credited to a QB as an interception are not the result of a breakdown of the above-mentioned factors. In some cases, catchable passes bounce off of pass catchers into the open arms of defenders. In other cases, a defender drops a poorly thrown ball that should have been an interception. Counting Interceptable Passes instead of just Interceptions goes a long way to remove these misleading examples.
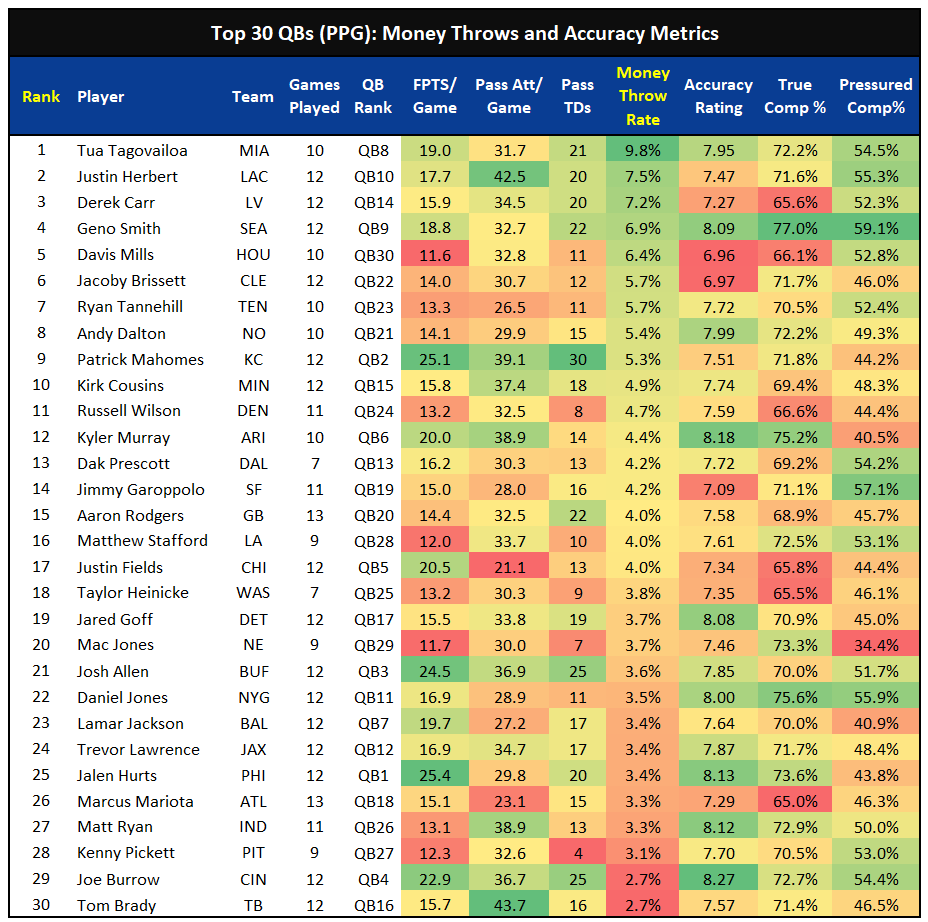
The following chart shows the current Top 24 QBs in points per game (PPG), who are currently their team’s starter and have played in at least five games. I am leaving in a few QBs who are no longer playing (Jimmy Garropolo, Jacoby Brissett, and Matthew Stafford) because they played enough of the season to where it is useful to include them here. This first chart includes accuracy metrics and includes the following data points to help visualize this discussion (sorted by Money Throw Rate, highest to lowest):
- Fantasy Points per Game
- Pass Attempts per Game
- Passing TDs
- Money Throws per Pass Attempt (Money Throw Rate – MTR)
- Accuracy Rating
- True Completion Percentage/Rate (TCR)
- Pressured Completion Percentage/Rate (PCR)
If you read my previous article diving into QB peripherals, you see a familiar name leading the NFL in Money Throw rate. Tua Tagovailoa averages a Money Throw on almost 10% of his pass attempts. He is also Top 10 in Accuracy Rating, True Completion Rate, and Pressured Completion Rate. I have never bought into the narrative this season that the scales of Tagovailoa’s success tip more toward having Tyreek Hill and Jaylen Waddle on the receiving end of most of his attempts rather than him just being a great QB. While having two WRs like Hill and Waddle would help any QB, he is not only smashing this season because of them. Regardless of who is getting the targets, leading the NFL in Money Throw Rate is a good indication that Tagovailoa’s success (both NFL and fantasy) is largely due to his own skill set.
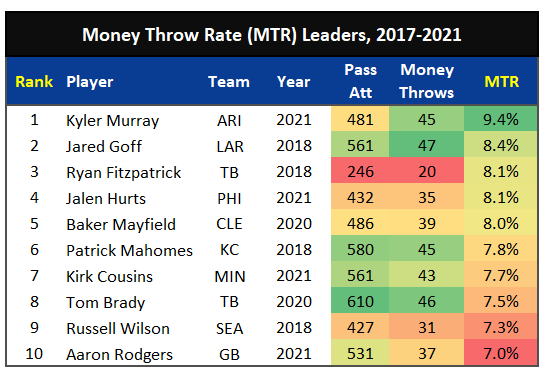
For a little more perspective, here are the Top 10 Money Throw Rates from 2017-2021 (minimum 200 pass attempts):
If the season ended today Tagovailoa would jump to the top of this list, with the only other two QBs also making the cut being Justin Herbert and Derek Carr. At only 317 pass attempts, the odds of Tagovailoa maintaining a 9.8% MTR are low, but a 10-game sample size shows it’s not a fluke.
To reiterate, MTR by itself doesn’t tell us a lot about fantasy production, as you can see with some of the other names in the Top 10 in 2022. And Joe Burrow, currently the overall QB4, sits at the bottom tied with Tom Brady with a 2.7% MTR.
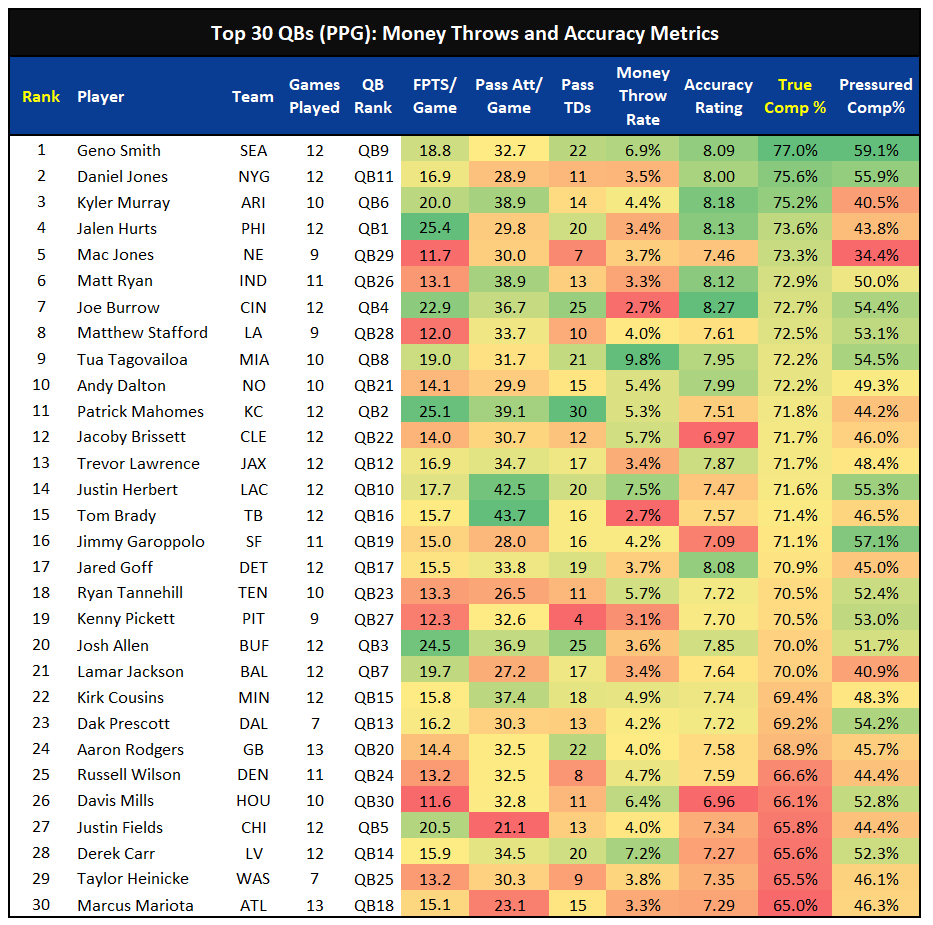
Here is the same data sorted by True Completion Rate (TCR):
Another QB I highlighted in the previous article sits atop the NFL in this category. Geno Smith checks in with a TCR of 77.0%. Smith has been the most accurate QB in the NFL across these metrics:
- MTR: 6.9% (4th)
- TCR: 77.0% (1st)
- Accuracy Rating: 8.09 (5th)
- PCR: 59.1% (1st)
Based on reputation and previous seasons, the most surprising name at the top of this group is Daniel Jones. Although his MTR is in the bottom 10 at 3.5%, Jones has been excellent across the accuracy statistics:
- TCR: 75.6% (2nd)
- Accuracy Rating: 8.00% (7th)
- PCR: 55.9% (3rd)
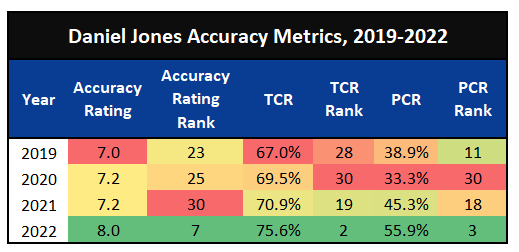
You can see the significant step forward Jones has taken in the accuracy department by looking at the same stats for Jones from 2019-2021:
Another interesting thing is the general vibe in 2022 is that Kyler Murray is having a subpar season. At QB6 you could make a case, but Kyler hasn’t been playing poorly. Murray is fifth in the NFL with 38.9 pass attempts per game, third in TCR (75.2%) and second in Accuracy Rating (8.18). I think what we are seeing is Murray’s absolute floor. And while Derek Carr has a high MTR, he is bottom five in TCR (65.6%, ahead of only Taylor Heinicke and Marcus Mariota).
Joe Burrow picked up where he left off in 2021, a year in which he led the NFL in completion percentage (70.4%). Burrow currently has the highest Accuracy Rating at 8.27.
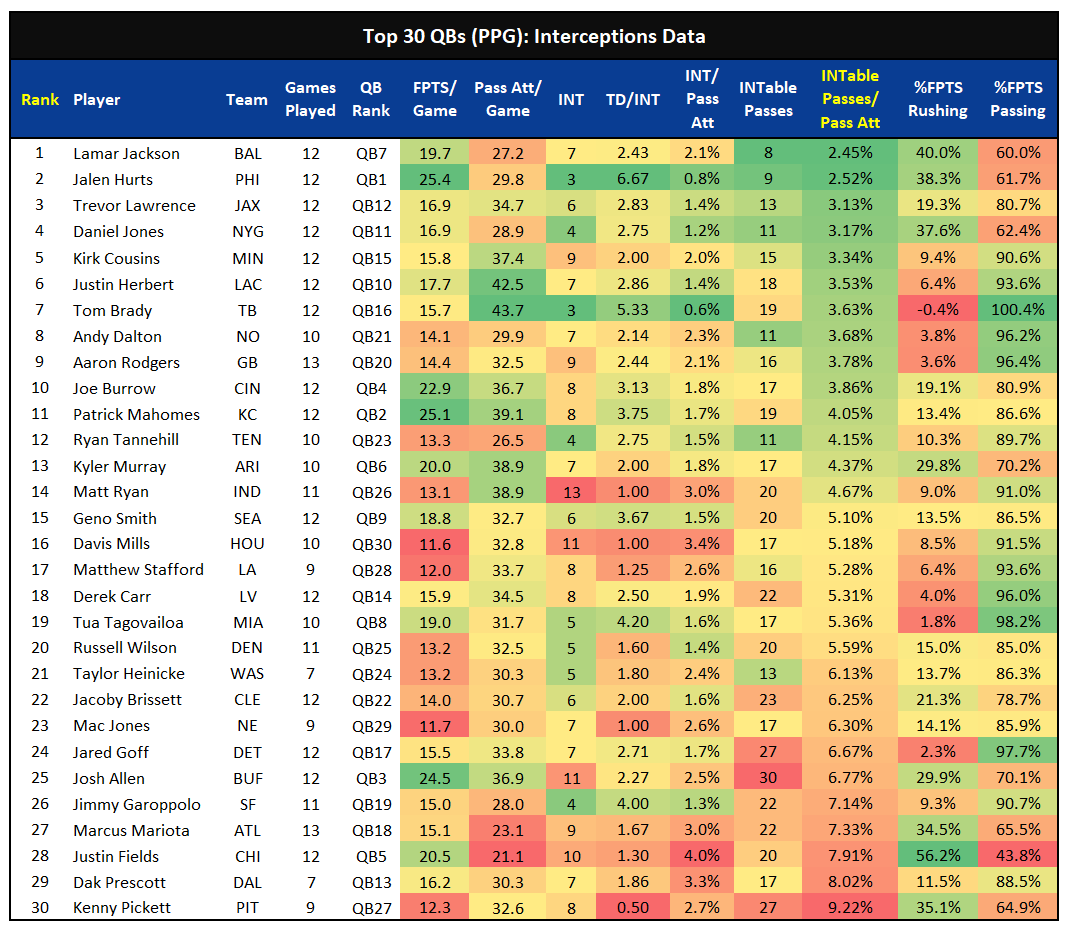
This second chart shows the turnover data discussed above for the same group of QBs (sorted by INTPA per Pass Attempt)
- Interceptions
- Interceptions per Pass Attempt
- Interceptable Passes (INTPA)
- Interceptable Passes per Pass Attempt
- TD-INT Ratio
The player who jumps out here is the current overall QB1, Jalen Hurts. Hurts is green across the board when it comes to not throwing the ball to the other team. Hurts’ 29.8 pass attempts per game are the seventh-fewest among this group, meaning you would expect him to have fewer interceptions. However, looking through the “per pass attempt” lens shows how good Hurts has been. Hurts has thrown an interception on only 0.8% of his pass attempts, the second-lowest rate after Tom Brady (0.6%). And only 2.52% of his pass attempts have been deemed interceptable, the second-lowest rate after Lamar Jackson (2.45%). Hurts’ TD-INT ratio of 6.67 is a league high, and, looking back at the accuracy data, Hurts has the third-highest Accuracy Rating in the NFL. Hurts has smashed any concerns about his abilities as a passer this season.
Two other names that stand out for a different reason are Justin Fields and Josh Allen. Fields leads the NFL with an INT per pass attempt rate of 4.0% and has the third-highest INTPA per pass attempt rate of 7.91%. Despite this, Fields is currently the overall QB5 in PPG. Josh Allen has the ninth-highest INT per pass attempt rate at 2.5% and the sixth-highest INTPA per pass attempt rate at 6.77%. Allen is currently the overall QB3. These are the two QBs for which I added the columns showing the rushing-passing breakdown in fantasy scoring. If you sort the INT and INTPA per pass attempts columns in descending order (highest to lowest), Fields and Allen are the only two QBs in the Top 10 for highest INT rates who are also Top 10 fantasy QBs. The reasoning for both starts with their rushing floor. Fields has scored a league-high 56.2% of his fantasy points via rushing output. Allen is quite a bit lower but still seventh-highest with 29.9% of his fantasy points produced on the ground. Allen makes up the difference with significantly more passing volume than Fields (36.9 pass attempts per game, seventh highest) and is tied for second with Joe Burrow with 25 passing TDs.
However, a rushing floor does not automatically bring a QB from interception-Ville into fantasy relevance. Kenny Pickett and Marcus Mariota have the highest and fourth-highest INTPA per pass attempt rates, respectively, and both score 30%+ of their fantasy points on the ground. Pickett is the QB27, and Mariota is the QB18.
Dak Prescott is on the wrong end of the spectrum as well. Here is where Dak stacks up across these metrics:
- TD-INT Ratio: 1.86 (tenth lowest)
- INT per Pass Attempt: 3.3% (third-highest)
- INTPA per Pass Attempt: 8.02% (second-highest)
I’ll end on a positive note. Trevor Lawrence has quietly been having a very good bounce-back sophomore season. During his rookie year in 2021, Lawrence threw 50 passes that were interceptable, resulting in 17 interceptions and an 8.3% INTPA per pass attempt rate, both league highs. Through 12 games so far in 2022, Lawrence’s INTPA per pass attempt rate sits at 3.13%, the third-lowest rate after Lamar Jackson and Jalen Hurts. While the Jaguars have a brutal fantasy playoff schedule for their passing game, the future looks bright for Lawrence and the Jaguars’ offense.
Thanks for reading! If you have any questions about the data used in this article or about fantasy football in general, feel free to hit me up on Twitter.

